
SSIS Pipeline performance counters
SSIS Pipeline performance counters monitor the processes which are related to the execution of packages and the Data flow engine’s the most crucial feature, the (Data) Pipeline. Their measurements reveal in which way the memory resources are acquired during the execution of the SSIS packages, and also, show the amount of memory used during that events. The proficient monitoring of the SSIS Pipeline memory usage can mitigate the potential issues of memory and data leakage, data transformation interruptions and overall, avoid data integration damage.
It should be noted that measurements of these performance counters are always aggregated, and they show the performance of the entire SSIS service, not just package execution.
Performance counters of SSIS Pipeline type are grouped in six groups:
Packages execution
BLOB
Buffer
Private buffer
Flat buffer
Rows performance counters
-
Package execution performance counters
SSIS Package Instances: this counter shows current number of simultaneous SSIS Packages running.
Note: To determine issues related to multiple packages execution, constructing the flow of main packages and subpackages in proper order should be applied (when executing dependent packages e.g.), so all of the transformations fit in memory while processing. Also, the EngineThreads property can be set in according to the number of package executions (threads) needed. The SSIS engine itself will not use more threads than needed, and it will regard the set property’s value.
Default value for this counter that is showing in aggregated measurements is -1, which represents the maximum number of package executions, in addition with number of processors, plus two. For example, if packages are executing with quad core processor, the value is 6.
-
BLOB performance counters
BLOB bytes read: it displays the sum of bytes read from the BLOB data (Binary Large OBjects) from the all accessible sources in monitoring cycle.
BLOB bytes written: this performance counter shows the sum of bytes written to BLOB on all targeted destinations in monitoring cycle.
BLOB files in use: it displays the number of BLOB files in use (for spooling), during Data flow engine task in period of monitoring.
Note: BLOB-based temporary data can easily overwhelm one single buffer during the execution of packages, so, the temporary storage is needed to be set just for BLOBs processing. It could slip over to the logical disk storage, if physical RAM is 100% allocated, which slows down the performance of SSIS Pipeline. In order to optimize the usage of that data during the package execution, the BLOBTempStoragePath in parallel with the BufferTempStoragePath properties should be set for particular columns that contain BLOBs, otherwise, the default values will be applied for TEMP variables.
Values that are displaying in aggregated measurements are byte strings, numeric values which represent the allocated space on logical disk in bytes (e.g. 2.147.483.648 bytes, which are 2 GB).
-
Buffer performance counters
By default, the Integration Services service runs independently from the SQL Server service instance, optimizing and allocating the memory resources for itself when multiple data transformations are occurring. This buffer-oriented framework (where the buffer is defined as a manageable memory object which holds a data) makes the whole process highly efficient. Therefore, the SSIS Pipeline performs in-memory data processing.
It begins with reading a set of data (rows) from the source, then loading selected data in a buffer, transforming the data and writing to the destination. Processing the large amount of data is common in a BI environment, and, as such, it requires using a certain number of buffers (managed by internal SSIS buffer manager), instead of loading the data on physical storage. In accordance to the transformation and already transformed (processed) data, buffers are being reallocated by other buffers which are part of the parallel transformation process (asynchronous transformation), or being deallocated and ready for the next data transformation process.
Buffers in use: this displays and details how many pipeline buffers are being used by Data flow engine components during the monitoring cycle.
Buffer memory: this performance counter shows the amount of memory that is currently used in monitoring cycle, including both virtual and physical instances that regard the Data flow engine. If the Buffer memory value is higher than actual physical memory, then the Buffers spooled value will show increased memory swapping (exchange between RAM and physical storage).
Buffers spooled: this displays the number of buffers currently written to logical disk during the data flow engine process during the period of monitoring. Buffers that aren’t currently used are always loaded to storage and reloaded when needed, typically when the data flow engine is running low on physical memory.
If the value of Buffers Spooled counter is 0, the transformation is occurring only in memory, without writing any data on a disk, and if that value is higher than 0, it is a sign that process needs more memory for the package execution.
Note: Default buffer-allocated size of a memory is 10MB, and the maximum size is 2GB (both for 32-bit and 64-bit systems). Therefore, the values for Buffer counters (except Buffers spooled) are showing in bytes (as numeric value) in aggregated measurements.
-
Private buffer performance counters
Instead of being created by an SSIS instance, private buffers are created by particular transformation process themselves. Their purpose is to support and optimize the performance of temporary tasks in Pipeline, like the Aggregation transformation, Sort transformation etc.
Private buffer memory: this performance counter shows the full amount of physical or virtual memory used by all of the current private buffers within the Data Flow engine task in the monitoring cycle. During a data transformation, if the Data flow engine creates a buffer to support itself (not the transformation), that buffer is not considered as private. Value in aggregated measurements for this counter is showing in bytes (as a numeric value, e.g. 100.000.000 bytes, which is 100 MB).
Private buffers in use: this displays the amount of blocks of memory that data transformations use for itself certain point in time at a certain point in time.
Value in aggregated measurements for this counter is displaying as a numeric value (e.g. 2 memory blocks).
-
Flat buffer performance counters
Flat buffers are the special type of private buffers, which use blocks of memory independently. Transformation processes that occur in flat buffers process intact blocks of data, undivided into rows/columns.
Flat buffer memory: this shows which amount of memory that all of flat buffers allocate in the monitoring cycle.
Flat buffers in use: this performance counter calculates the amount of memory blocks used by the Data flow engine task at a certain point in time.
Note: Value in aggregated measurements for these counters is displaying as a numeric value, same as for the each of Private buffer performance counters.
-
Rows performance counters
These performance counters provide information about the progress of package execution.
Rows read: this counter calculates the full amount of rows during transformation which are read from the source at a certain point in time. They are also called “input rows”, and the rows read from reference tables (within Lookup transformation) are not included by default.
Rows written: this displays the total number of rows that are written to the destination. They are also called the “output rows”.
Note: The values that are showing in aggregated values can be from 0 to 10.000, because the default maximum number of processed rows per transformation is 10,000.
Important SSIS Pipeline performance counters for monitoring
For discovering the source of memory or data leakage, Buffers in use, Private buffers in use and Flat buffers in use performance counters should be in focus. Their values at the beginning of the packages execution should be the same in the end of the process, otherwise, buffers may be “leaking” memory and data integration could be damaged.
In addition, Rows Read and Buffers Spooled are also the important SSIS Pipeline performance counters, because they provide the insight for which amount of transformed data and to point on the potential risk of memory leakage and impact on the logical disks.
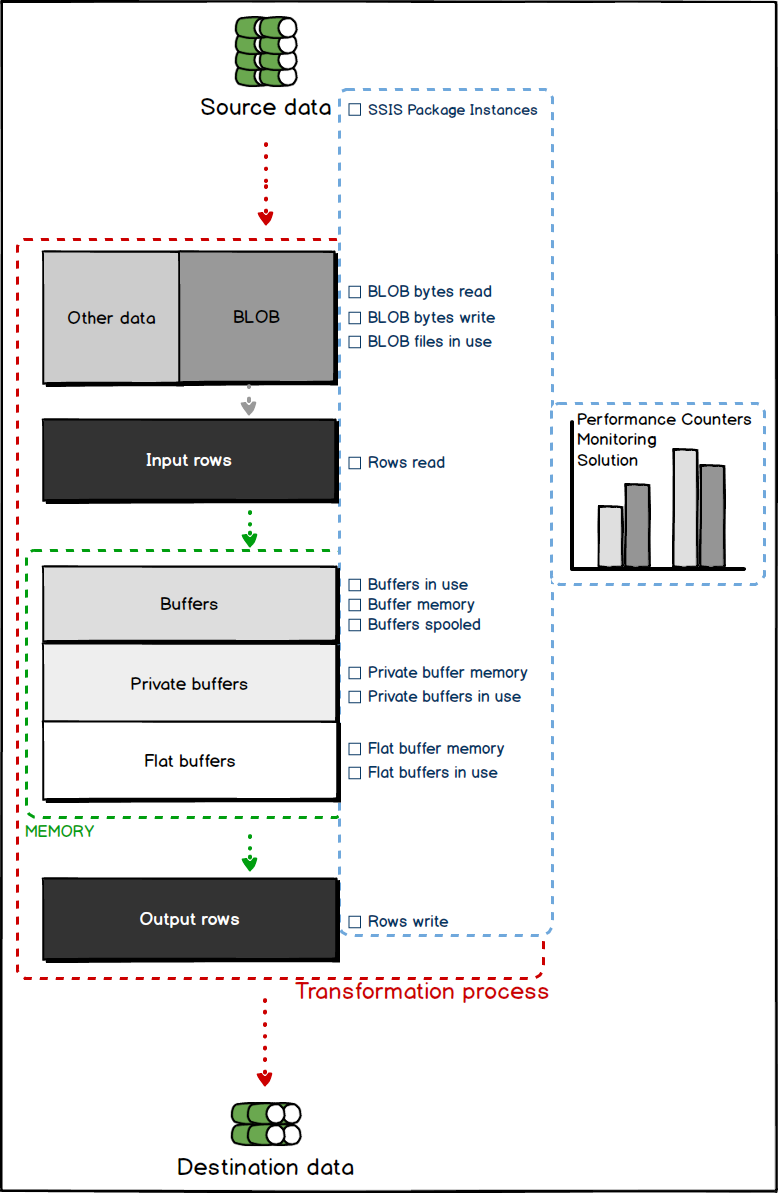
To understand better what is happening while data is transformed and processed in-memory, from the source to the destination, including the schema of theoretical Performance counter monitoring solution see the illustration below.
Useful links

Daniel is currently working for ApexSQL LLC as Software sales engineer where he specializes for the BI environment.
- How to monitor the SQL Server tempdb database - July 6, 2017
- How to monitor total SQL Server indexes size - June 12, 2017
- How to set and use encrypted SQL Server connections - May 8, 2017