In the previous articles of this series (see the index at bottom), we discussed many aspects of the SQL Execution Plans, starting with the main concept of SQL Execution Plan generation, diving in the different types of the plans and showing how to analyze the components and operators of the SQL Execution Plans.
In all these articles, we presented the discussions using the default graphical user interface tool for Microsoft SQL Server, SQL Server Management Studio. And as we discussed in the SQL Execution Plan enhancements in SSMS 18.0 article, how Microsoft keeps enhancing the SQL Execution Plan aspect of SSMS. On the other hand, there are a number of 3rd party tools that shine in the SQL Server Administration and Development market, that also follow the new releases of the SQL Server Engines and the enhancements in the existing features, to provide database administrators and developers an easy way to display, analyze and tune SQL Execution Plans of the submitted SQL Server queries.
In this article, we will go through one of those 3rd party tools, ApexSQL Plan, SQL execution plan viewer, that helps in the opening, viewing, optimizing, exploring, and analyzing SQL execution plans. What makes it beneficial is that it helps to identify the different query performance issues, analyzing the query waits and live performance statistics, displaying the actual relative cost of each plan operator, profiling the stored procedures performance, generating lazy profiling reports, and comparing the estimated and actual query execution plans. And all these features are visualized using a customizable graphical query execution plan view.
In order to use ApexSQL Plan, you need first to download it from the ApexSQL Download page. The installation file for ApexSQL Plan is a small file, less than 40 MB size, as shown below:

ApexSQL Plan can be installed to your machine or server, by easily running the installation file and going through the simple installation wizard, that starts with the Welcome page shown below:
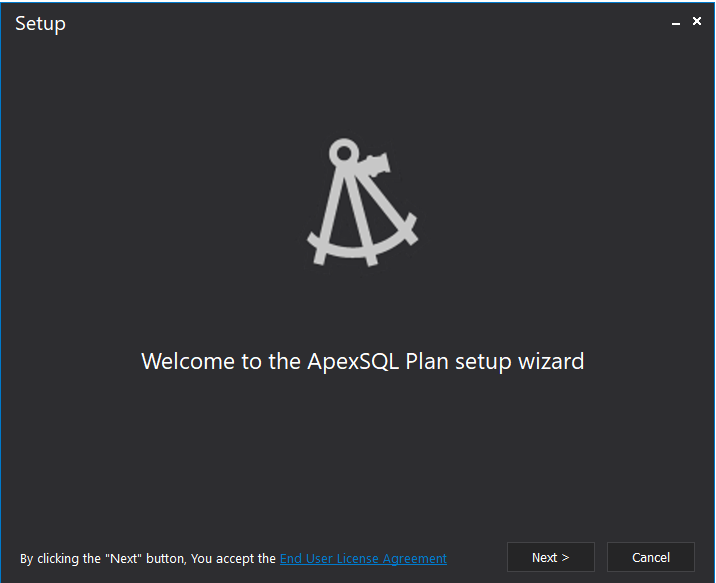
Check the End User License Agreement points then click on the Next button to accept the agreement and proceed to the next window, in which you need to specify where to install ApexSQL Plan, with minimum 156 MB free space on that drive, and if you need to create an icon for that tool on your desktop. After specifying the installation path of the ApexSQL Plan click Next:
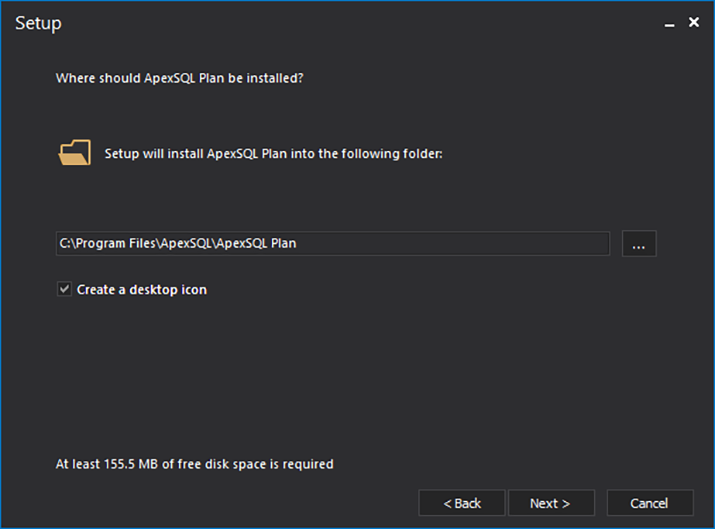
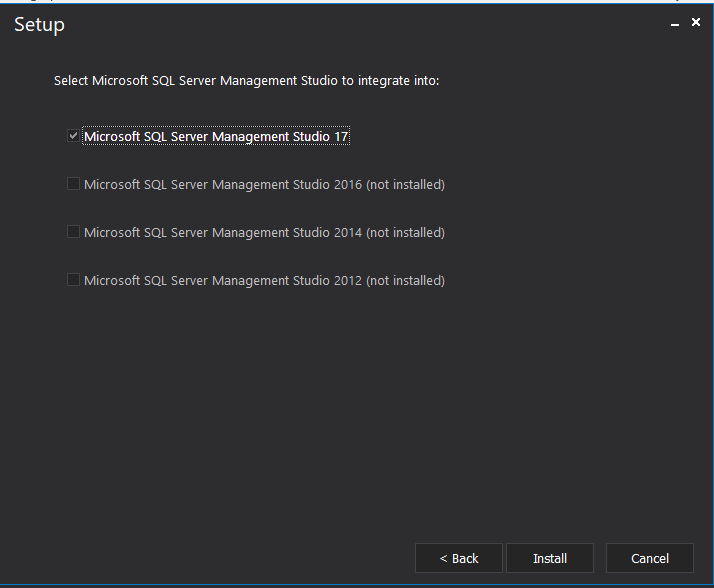
In the next step, ApexSQL Plan will detect the installed SQL Server Management Studio versions to decide which SSMS version to integrate ApexSQL Plan into. Specify the latest SSMS version to integrate the ApexSQL Plan into then click Install to start the installation, as shown below:
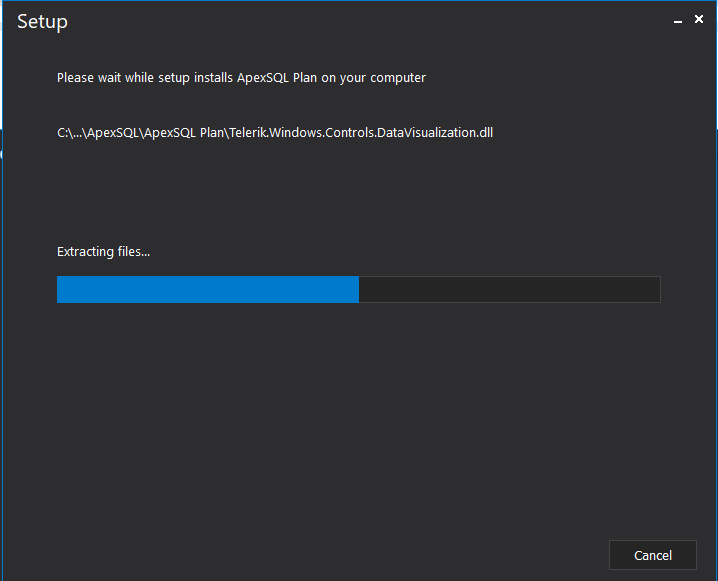
The ApexSQL Plan installation progress bar is very indicative, showing the current status of the installation operation and which .dll file is being processed now, as shown below:
When the installation process completed successfully, you can view the release notes for ApexSQL Plan and click Close to start using ApexSQL Plan, as below:

When opening ApexSQL Plan, you will see that it consists of four main menus. The first menu is the Home menu, from which you can start a new Execution Plan session, open an existing one or save the current session for future analysis, and other analytical options as shown below:
The Options button from the Home menu provides you with the ability to control the layout modes, styles, rotating, colors and theme, controls displaying extra information in the Execution plan, and other exporting options, as shown below:

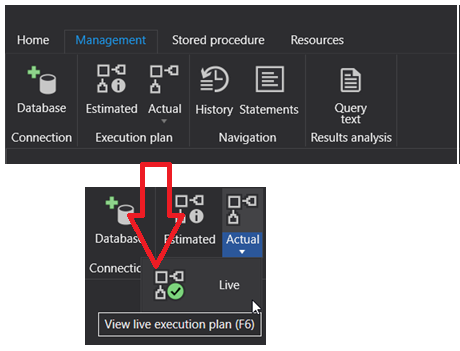
The Management menu is an important menu, from where you can specify the connection parameters to the SQL Server, the type of the Execution Plan to be generated, displaying the query statement and the generated Execution Plans history, as shown below:
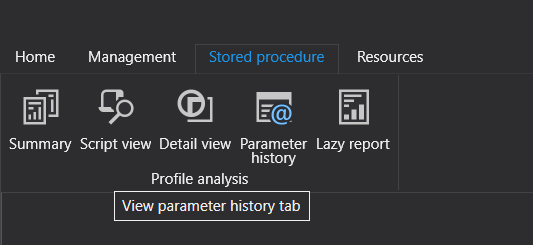
Browsing the Stored Procedure menu, you will see the different options that will help you in analyzing the parameterized stored procedures, showing the parameters history and the lazy report for that SP, as shown below:
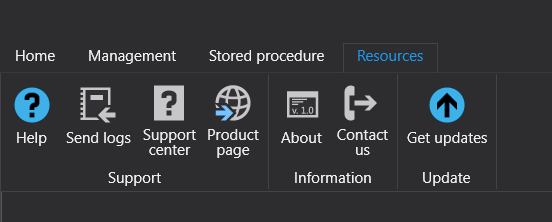
The last menu, but not the least, is the Resources menu that helps in contacting the ApexSQL Plan support team in case you face any issue and getting the latest updates for that tool, as shown below:
In a simple three steps, let us try to generate full execution plan diagram that can be resized, rescaled for a simple query and check how this wonderful tool can help us analyzing that query:
- From the Home menu, click on the New button and type the query that you manage to analyze
-
From the Management menu, click on the Database button and specify the SQL Server, the Authentication method and credentials and the database name, as below:
-
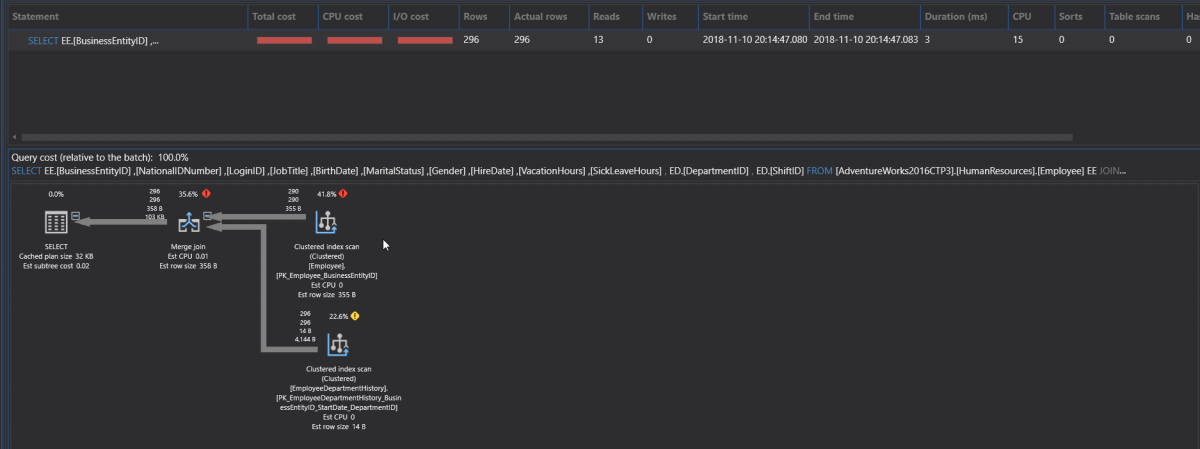
Now you are connected to the SQL Server. From the Management menu, choose the type of Execution Plan you need to generate (Estimated, Actual or Live plan), and the Execution Plan will be generated directly, as shown below:
And if the SQL Server Engine detects that there is a missing index that can be used to enhance the performance of your query, ApexSQL Plan will display that recommendation and the enhancement percentage of that index creation on your query, with the ability to copy the CREATE INDEX statement or create it directly, as shown below:
At the top of the generated SQL Execution Plan, you can see the execution statistical information of the submitted query, including the number of returned rows, number of reads performed, the query duration , the CPU cost and other useful information that helps in analyzing the query.
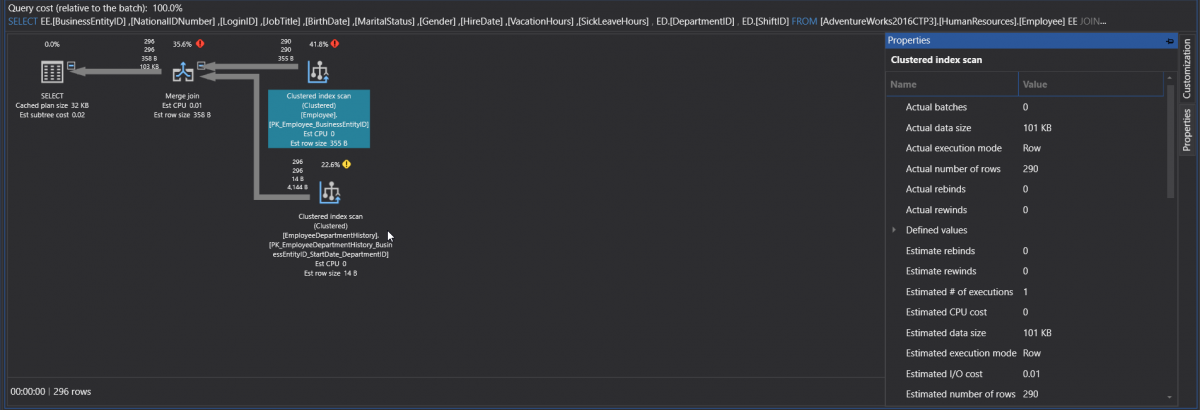
What also makes ApexSQL Plan very useful, is the colorful Execution Plan operators and the useful information shown beside each node and arrow, without the need to dig deeply on each operator tooltip to get a specific information. In addition, if you click on an operator, you can view the Properties window of that operator, that describes the operator execution cost and information as shown clearly below:
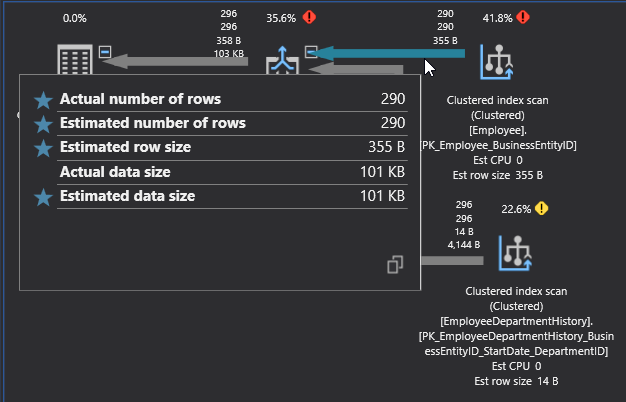
And we cannot ignore the importance of the tooltip that will be displayed when pointing the mouse pointer on any operator or arrow, with the ability to copy the displayed information to the clipboard, as shown below:
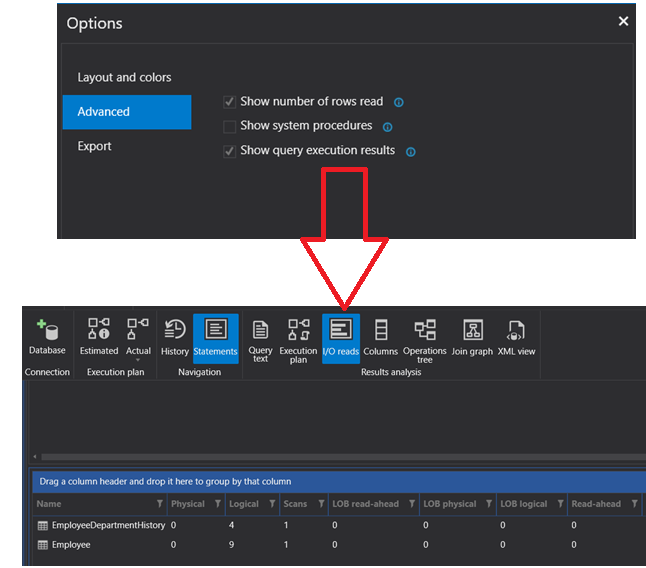
From the previous single operation of the Execution Plan generation, ApexSQL Plan hides any extra statistical information about the query execution. If you click on the I/O reads option from the Management menu, after configuring that tool to show the number of read and the execution result, it will show you a detailed information about the physical and logical I/O operations performed while executing the submitted query, as shown below:
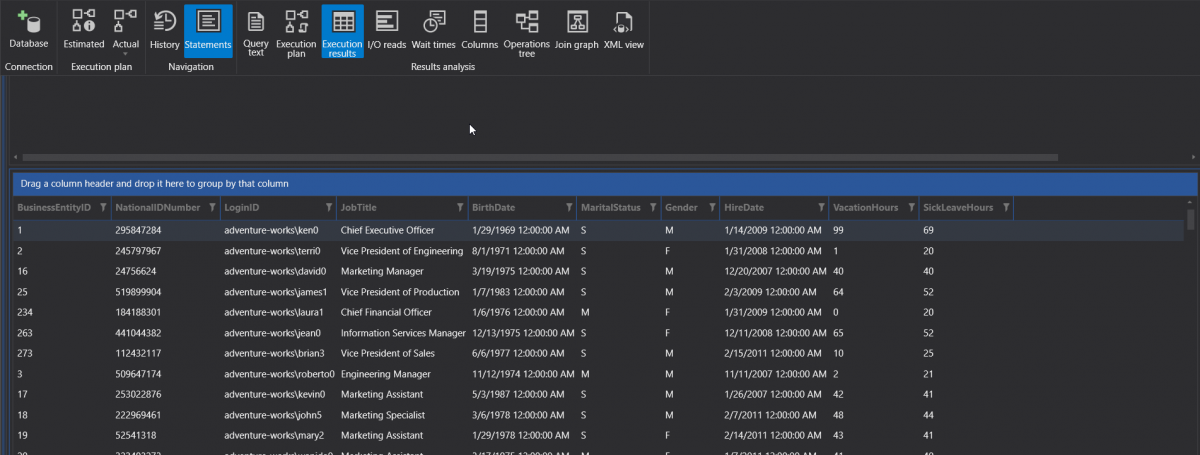
And the query result will be returned in a separate tab, as below:
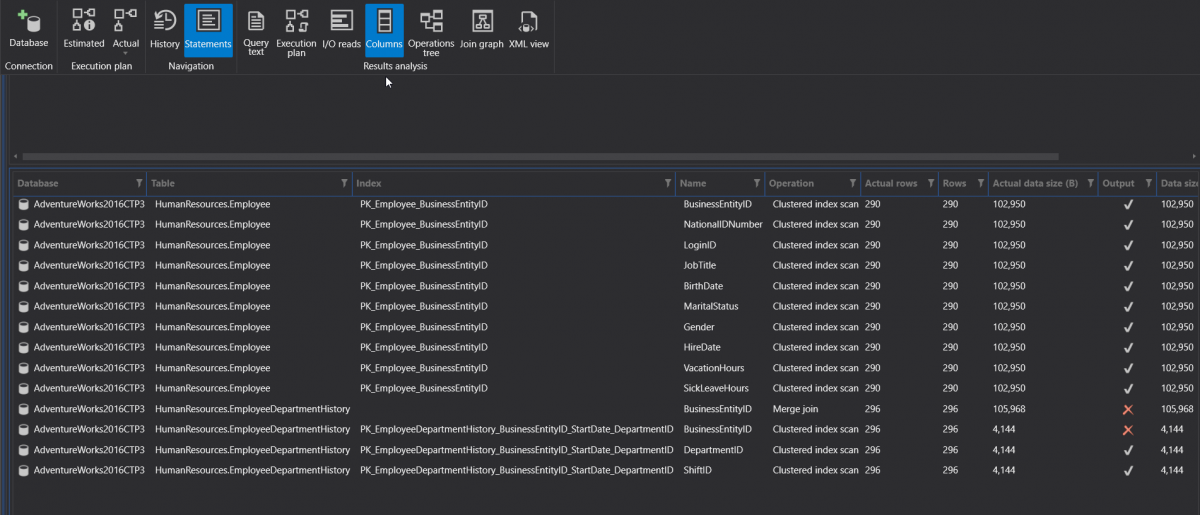
And from the same Management menu, you can see the list and the data size of the columns from each participating table, that the SQL Server Engine touched when executing that query, with the number of the rows and if it is returned by the query or not, by clicking on the Columns option, as shown below:
The Operations Tree option from the Management menu, will display the list of operations, such as index scan or seek, that are performed to retrieve the requested data in your query, with all statistical information about that operation, as shown below:

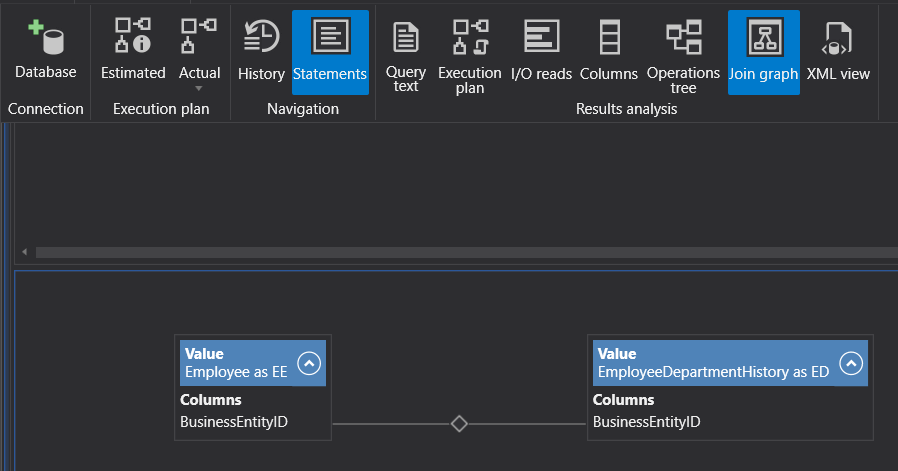
In case your query contains JOIN clause, the Join Graph option from the Management menu will display the graph that describes the JOIN operation between the participating tables, as below:
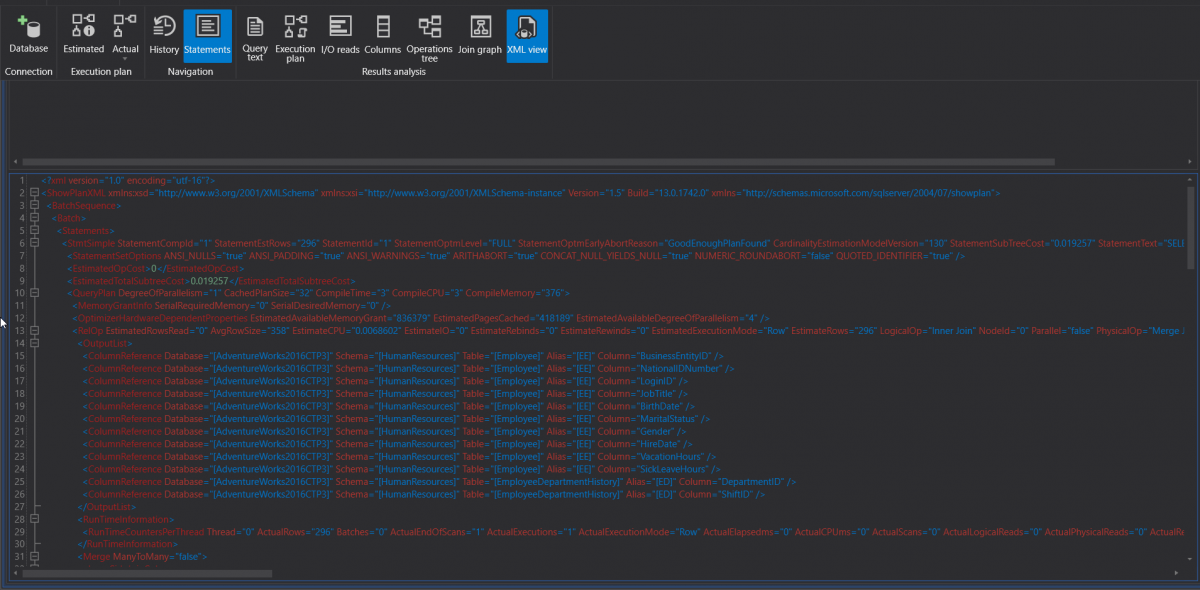
ApexSQL Plan allows you also to display the generated Execution Plan in XML format, using the XML View option from the Management menu, as shown below:
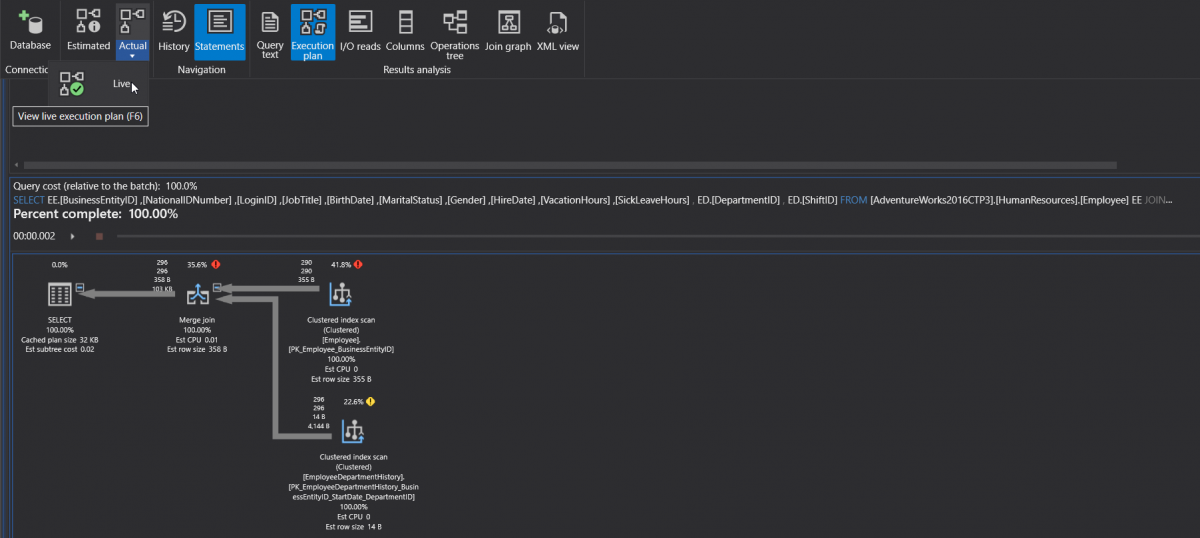
Similar to SQL Server Management Studio, ApexSQL Plan provides you with the ability to generate a Live Actual Execution Plan, to analyze the query execution process in real-time and observe the data flow during execution. If you need to check the same plan again, you need to repeat the plan generation and query execution another time in the case of SSMS. ApexSQL Plan will keep that generated plan for you as a movie, that will be recorded and repeated multiple time, without the need to execute it again, as shown below:
The History option of the Management menu allows you to check the different Execution Plans generated in that session and compare these plans before and after the query optimization, as shown below:
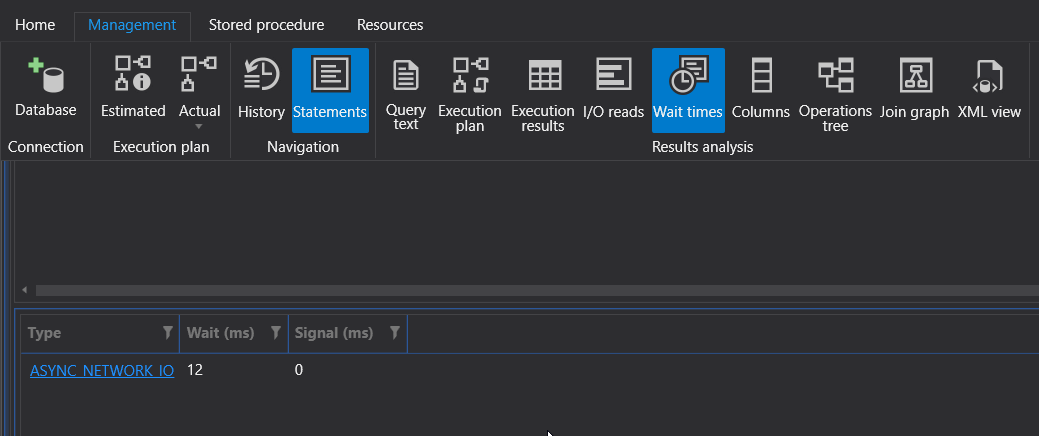
ApexSQL Plan provides you with the main performance monitoring key in SQL Server, that helps analyzing the query performance and identify the execution bottleneck with correct wait and signal time, by showing the list of resources that the submitted query is waiting for, from the Wait Times option of the Management menu, as shown clearly below:
In this article, we discussed only sample of the features that are available in ApexSQL Plan. If you install it to your machine, you can discover other useful features, such the Query performance that provides you with the slowest queries recently executed, by defined criteria, including all key details, Open Query Store that helps reviewing the query execution data collected from the Query Store, the Query Store dashboard that helps checking the top queries based on average duration, execution count, executed rows, Deadlock diagrams analysis, Stored procedure profiling information and parameters analysis, and more.
Still waiting! Go and install it to dive in its useful features.
Table of contents
- Azure Data Factory Interview Questions and Answers - February 11, 2021
- How to monitor Azure Data Factory - January 15, 2021
- Using Source Control in Azure Data Factory - January 12, 2021


