In this article, in the series, we’ll discuss understanding and preparing data by using SQL unpivot.
Read more »

In this article, in the series, we’ll discuss understanding and preparing data by using SQL unpivot.
Read more »
In data science, understanding and preparing data is critical, such as the use of the SQL pivot operation. In this article, in the series, we’ll discuss understanding and preparing data by using SQL transpose and SQL pivot techniques.
Read more »
You might find the T-SQL GROUPING SETS I described in my previous data science article a bit complex. However, I am not done with it yet. I will show additional possibilities in this article. But before you give up on reading the article, let me tell you that I will also show a way how to make R code simpler with help of the dplyr package. Finally, I will also show some a bit more advanced techniques of aggregations in Python pandas data frame.
Read more »In data science, you analyze datasets. Datasets consists of cases, which are the entities you analyze. Cases are described by their variables, which represent the attributes of the entities. The first important question you need to answer when you start a data science project is what exactly is your case. Is this a person, a family, an order? Then you collect all of the knowledge about each case you can get and store this information in the variables.
Read more »
Previously, in this Data science series, I already tacitly did quite a few aggregations over the whole dataset and aggregations over groups of data. Of course, the vast majority of the readers here is familiar with the GROUP BY clause in the T-SQL SELECT statement and with the basic aggregate functions. Therefore, in this article, I want to show some advanced aggregation options in T-SQL and grouping in aggregations of data in an R or a Python data frame.
Read more »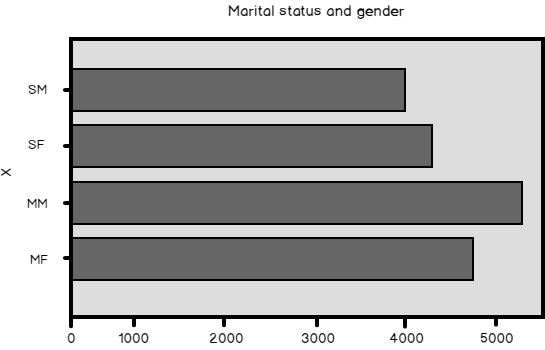
In my previous four articles, I worked on a single variable of a dataset. I have shown example code in T-SQL, R, and Python languages. I always used the same dataset. Therefore, you might have gotten the impression that in R and in Python, you can operate on a dataset the same way like you operate on an SQL Server table. However, there is a big difference between an SQL Server table and Python or R data frame.
Read more »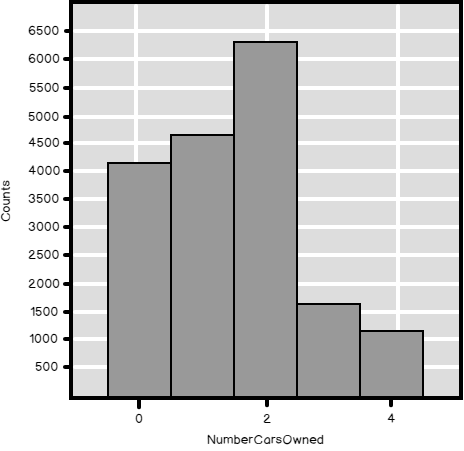
In this article, in the data science: data analysis and transformation series, we’ll be talking about information entropy.
Read more »
I started to explain the data preparation part of a data science project with discrete variables. As you should know by now, discrete variables can be categorical or ordinal. For ordinal, you have to define the order either through the values of the variable or inform about the order the R or the Python execution engine. Let me start this article with Python code that shows another way how to define the order of the Education variable from the dbo.vTargetMail view from the AdventureWorksDW2016 demo database.
Read more »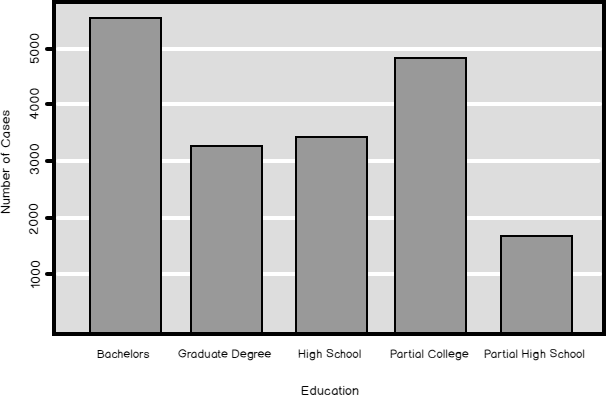
In my previous article, Introduction to data science, data understanding and preparation, I showed how to make an overview of the distribution of a discrete SQL variable. I analyzed the NumberCarsOwned variable from the dbo.vTargetMail view that you can find in the AdventureWorksDW2016 demo database. The data science graphs I created in R and Python and the histogram created with T-SQL were all very nice. Now let me try to create a histogram for another SQL variable from that view, for the Education variable. I am starting with R, as you can see from the following code.
Read more »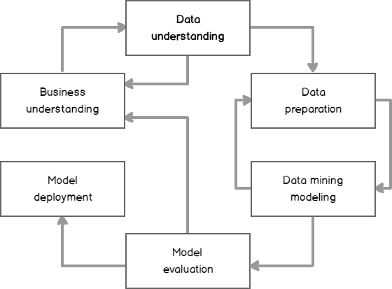
Data science, machine learning, data mining, advanced analytics, or however you want to name it, is a hot topic these days. Many people would like to start some project in this area. However, very soon after the start you realize you have a huge problem: your data. Your data might come from your line of business applications, data warehouses, or even external sources. Typically, it is not prepared for applying advanced analytical algorithms on it straight out of the source. In addition, you have to understand your data thoroughly, otherwise you might feed the algorithms with inappropriate variables. Soon you learn the fact that is well known to seasoned data scientists: you spend around 70-80% of the time dedicated to a data science project on data preparation and understanding.
Read more »© Quest Software Inc. ALL RIGHTS RESERVED. | GDPR | Terms of Use | Privacy