In this article, we will review how to monitor AWS RDS SQL Server database instances and setup email notifications using event subscriptions and CloudWatch alarms.
Database monitoring is one of the important tasks of a database administrator to ensure availability and performance. AWS provides different tools to monitor the database instance. Below are some of the options.
- Amazon RDS Events
- Enhanced Monitoring
- CloudWatch metrics
- CloudWatch Alarms
- Database log files
AWS RDS Events
Whenever there is a backup, configuration change, snapshot, failover or maintenance, etc. on the database instance, an Amazon RDS event is created. These events can be subscribed to get an email notification. AWS RDS SQL Server uses SNS (simple notification service) to send a notification when an event occurs. These events are grouped into below categories.
- Availability
- Backup
- Configuration change
- Creation
- Deletion
- Failover
- Failure
- Low storage
- Maintenance
- Notification
- Read replica
- Recovery
- Restoration
For example, when a backup is started on AWS RDS SQL Server database instance an event is created in the backup category with the description “A backup of database instance is started”.
When a new parameter group is associated with database instance by modifying the instance, an event occurs in the configuration change category with the description “A parameter group for this DB instance has changed.”
Creating event subscriptions:
To receive emails notification on the Amazon RDS events, we need to create event subscriptions.
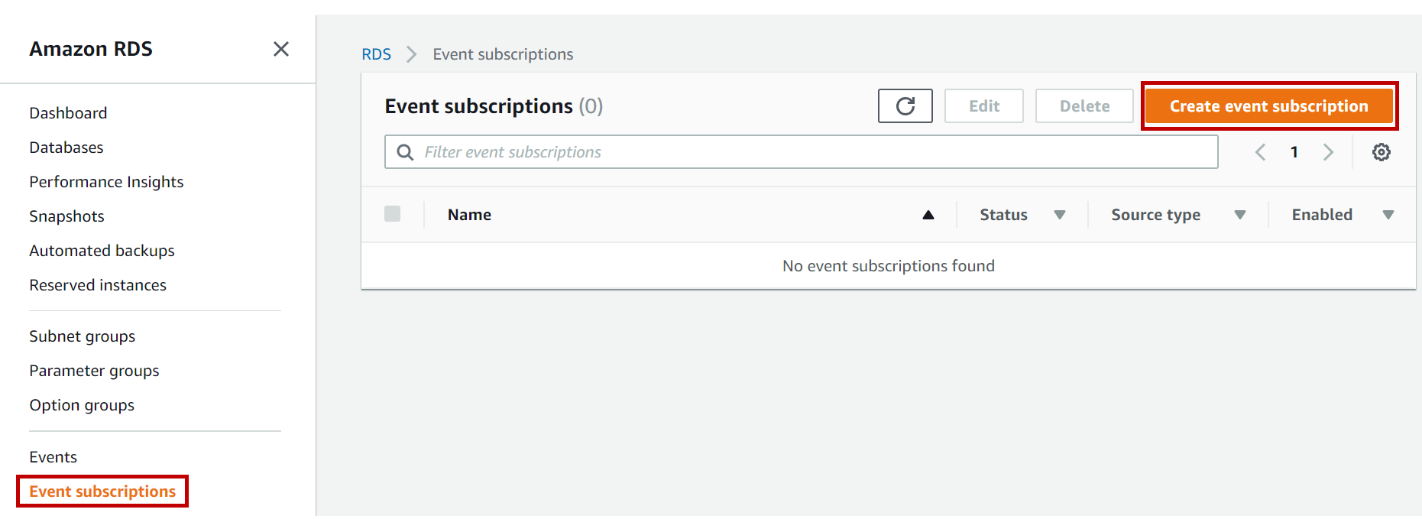
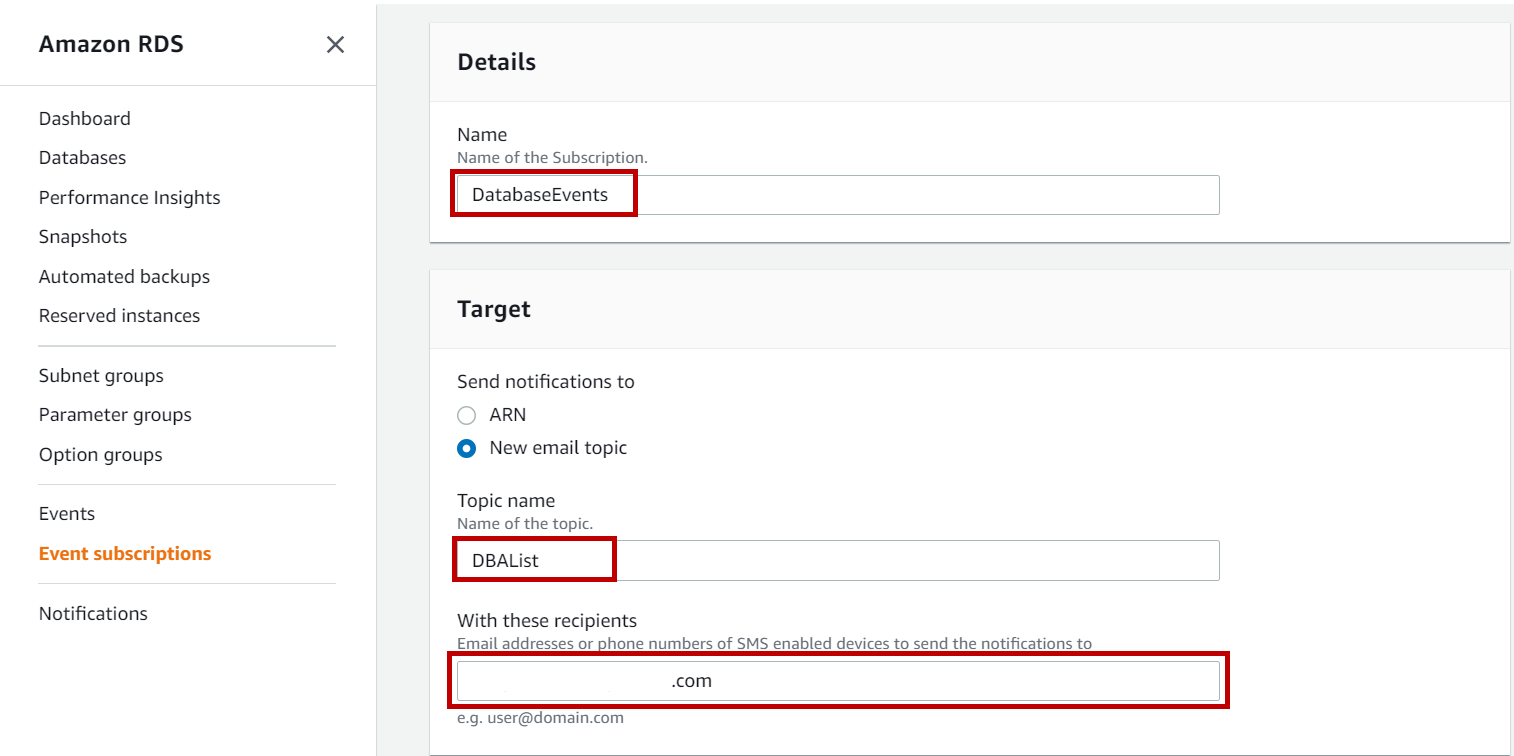
Navigate to Amazon RDS Console, Click on Event Subscriptions and click on Create event subscription.
In Create event subscription page, Input the name of the subscription. Select the ARN if you already have one or create a new by selecting New email topic. Enter the topic name and the email address to send the notifications.
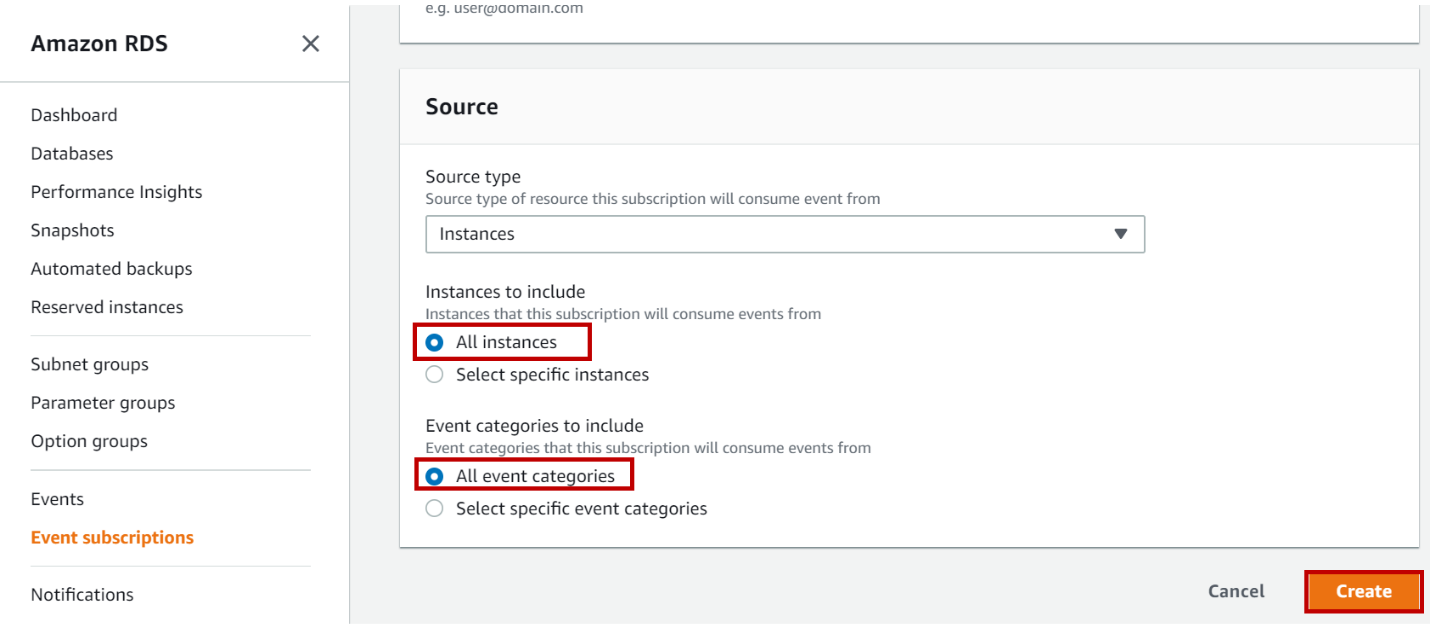
Now select the source type as instances. Select the database instances if you want to monitor specific instances else select All instances to monitor all instances in your AWS RDS SQL Server.
In event categories, select the categories to include if you want to receive notifications for specific categories or select All event categories and click on Create.
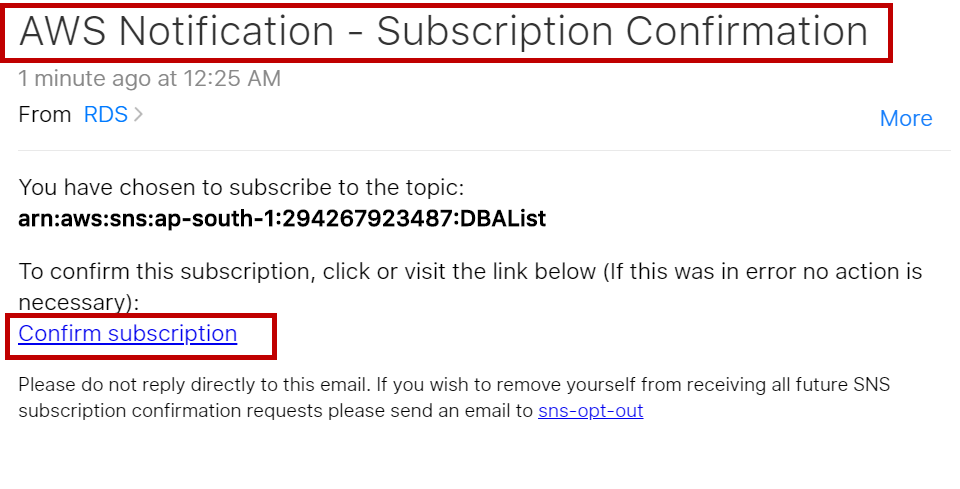
Once you create a subscription, open your mailbox, you will receive an email with subject as “AWS Notification – Subscription Confirmation”. Click on Confirm subscription to receive email notifications whenever the event occurs.
Once you click on Confirm Subscription, you will get a confirmation screen as below.
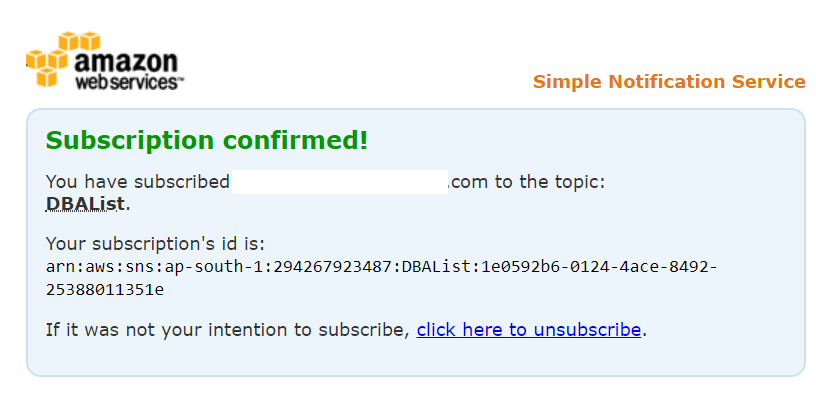
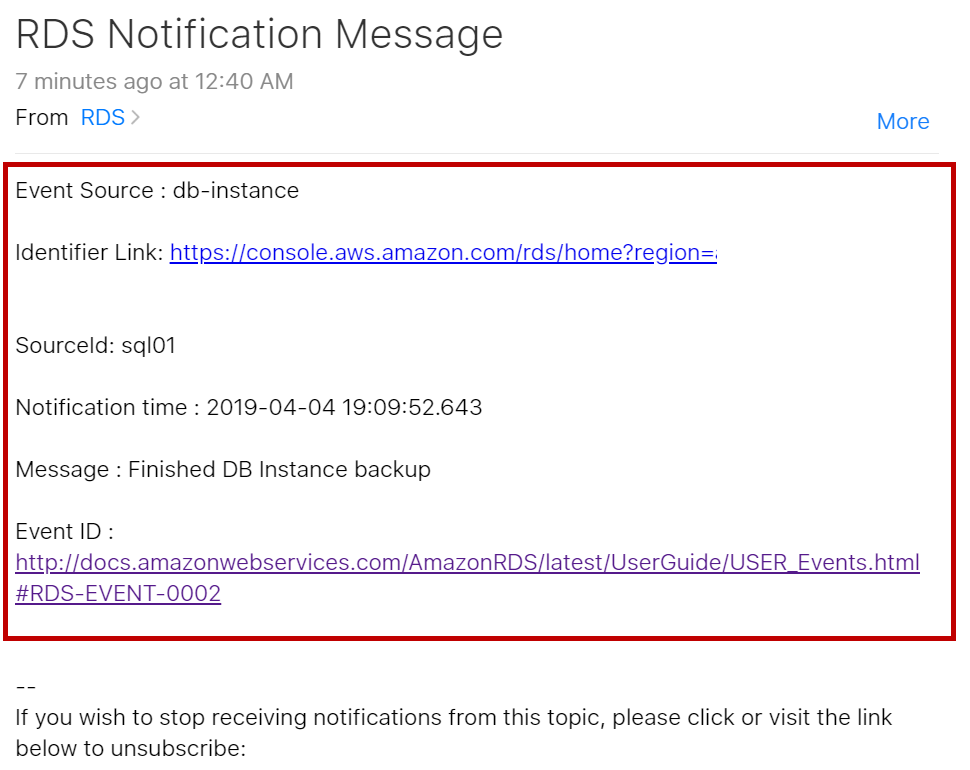
Now you will start receiving notifications when an event occurs as per categories and instances you selected while creating an event subscription. Below is sample email notification received for the backup complete event.
Source id is the database instance on which event occurred. Identifier Link is the link to navigate to database instance details page directly.
Disabling the event subscription:
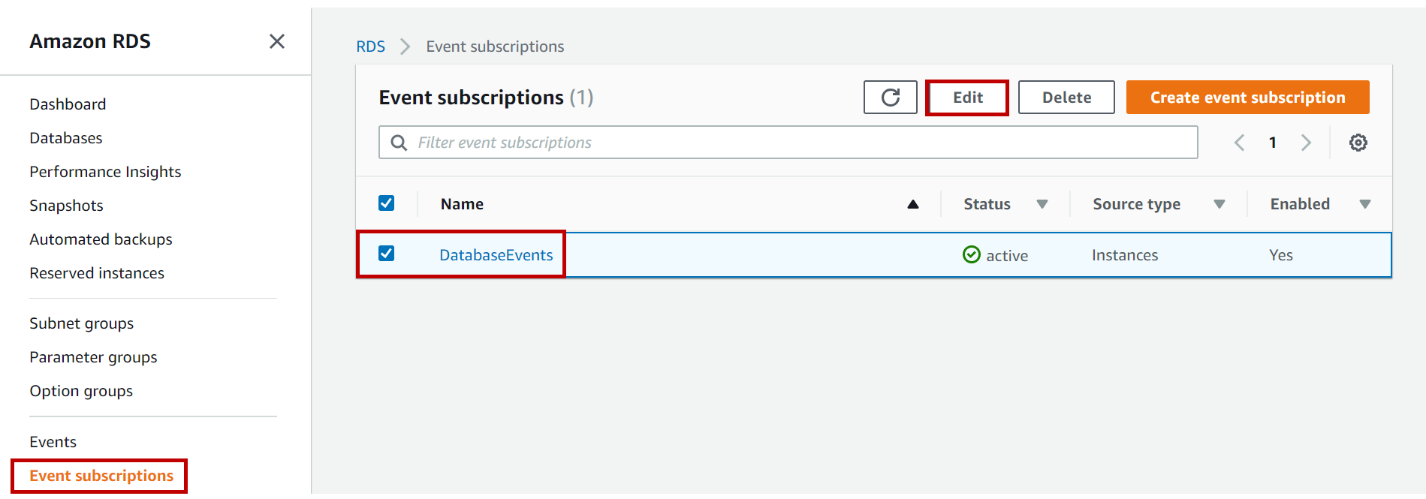
Click on Event Subscriptions. Select the subscription you want to disable and click on Edit.
In Edit event subscription page, select No in Details -> Enabled option and click Edit at the bottom of the page.

Enhanced Monitoring
Enhanced monitoring will provide metrics in real time for the operating system where your AWS RDS SQL Server database instance run. Enhanced monitoring can be enabled while launching a new database instance. If the database instance is already launched and you want to enable enhanced monitoring, navigate the databases on AWS RDS SQL Server console and select the instance for which you want to enable enhanced monitoring and click on Modify. Select Enable enhanced monitoring, Monitoring role, and Granularity. Click on Continue and modify DB instance at the bottom of the page.
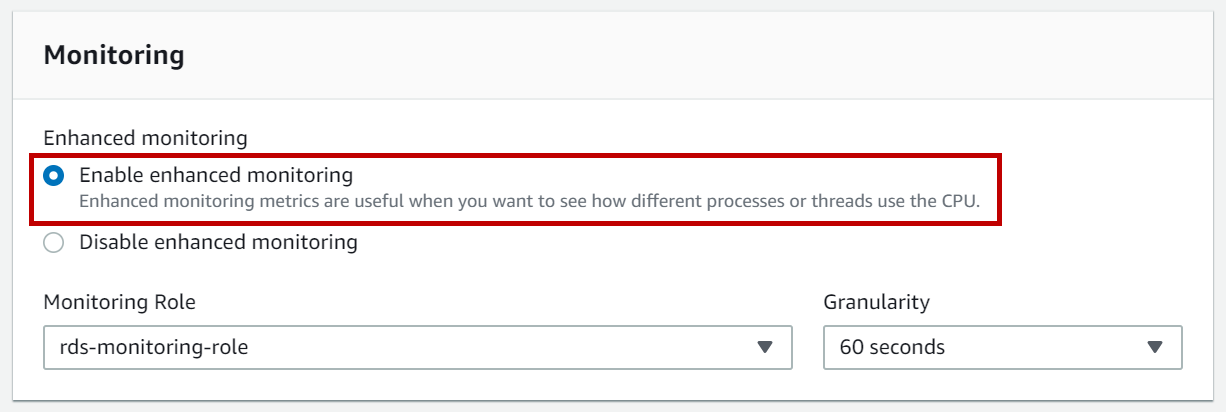
To view enhanced monitoring metrics, navigate to the databases on the AWS RDS SQL Server console, click on the database instance. In database instance details page click on Monitoring.
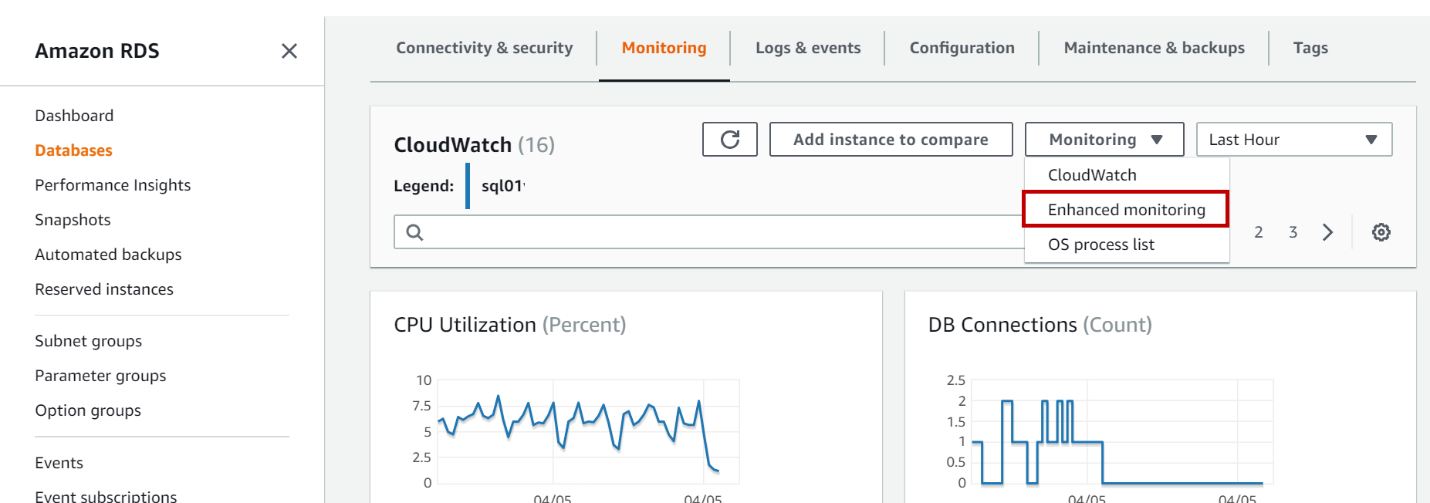
In the monitoring page, click on Monitoring drop down and select Enhanced monitoring.
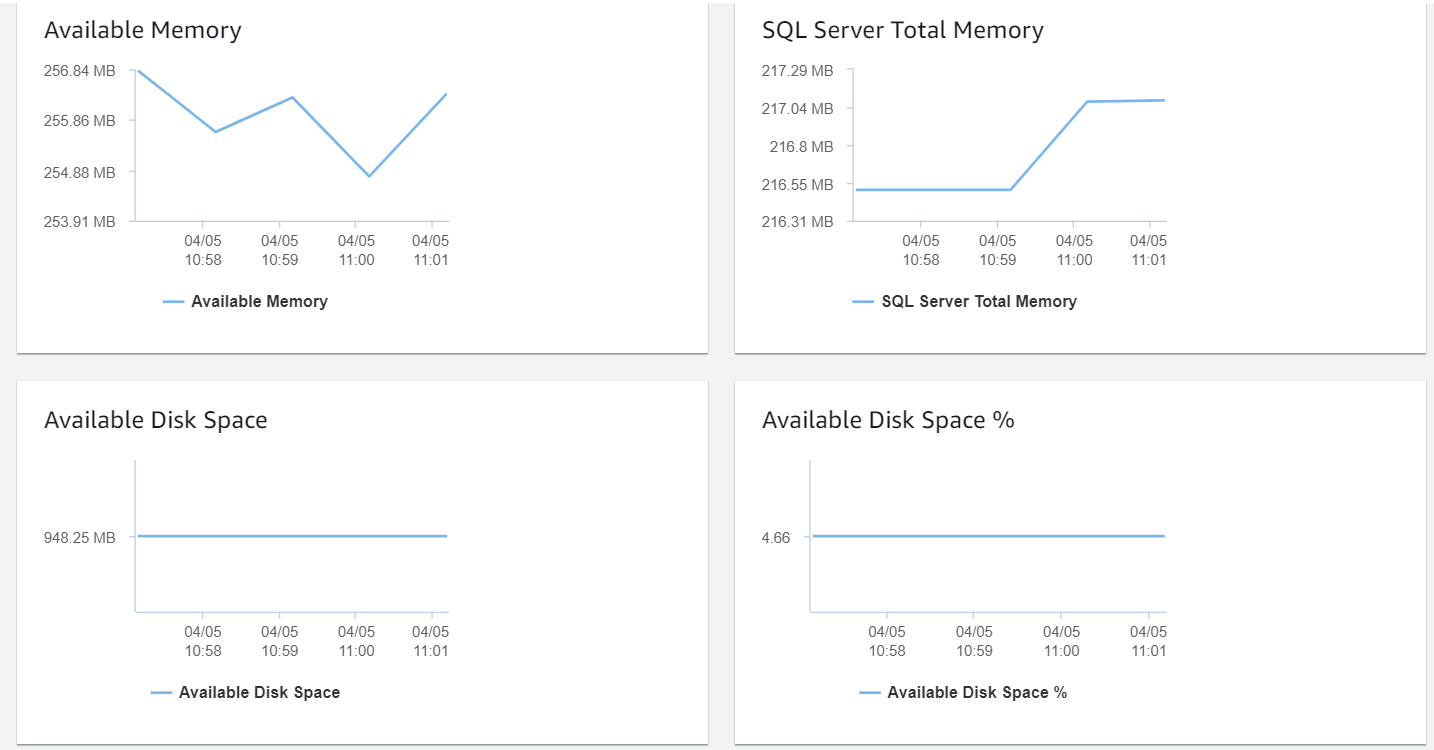
You can see the different graphs that show metrics related to Disk space, Memory and CPU. These graphs refresh the data based on Granularity you set while launching or modifying the database instance. Even though you set granularity to 1, the enhanced monitoring console refreshes every 5 seconds.
To add more graphs or remove the existing graphs you monitor, click on Manage graphs, select the options you need and click Save.
Enhanced monitoring metrics are stored in CloudWatch Logs. by default, the retention period of these logs is 30 days. If you want to modify the retention period of these logs, navigate to CloudWatch, Click on Logs. Select RDSOSMetrics group and Change the retention period under Expire Events After column.
You can also view these enhanced monitoring metrics from CloudWatch Logs. These logs will be updated based on the granularity we set in enhanced monitoring. These logs will be updated every second when the granularity is set to 1.
Navigate to CloudWatch Console, Click on Logs and click on RDSOSMetrics group. You will get the list of log streams. Select the latest log stream and you can see the metrics in JSON format.
Amazon CloudWatch Metrics
AWS RDS SQL Server send the metrics of each database to CloudWatch every minute. With CloudWatch metrics we can monitor both DB instance and OS metrics.
Viewing CloudWatch metrics in AWS RDS SQL Server console:
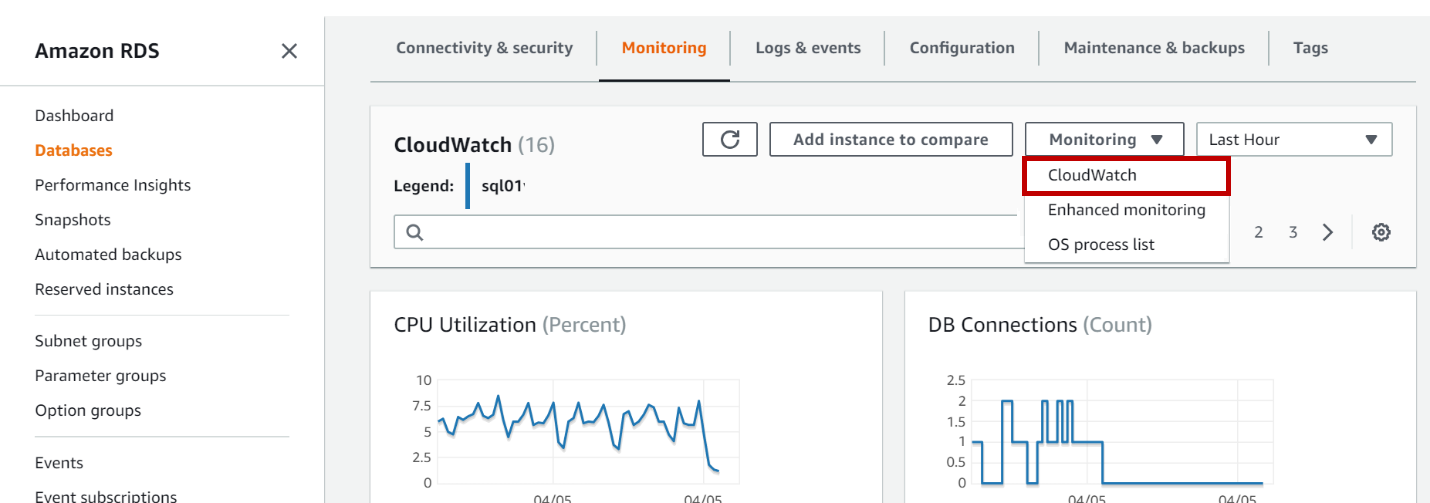
To view CloudWatch metrics, navigate to the database on the RDS menu, click on the database instance. In database instance details page click on monitoring.
Click on monitoring. In the monitoring page, click on Monitoring drop down and select CloudWatch.
Viewing CloudWatch metrics in CloudWatch Page:
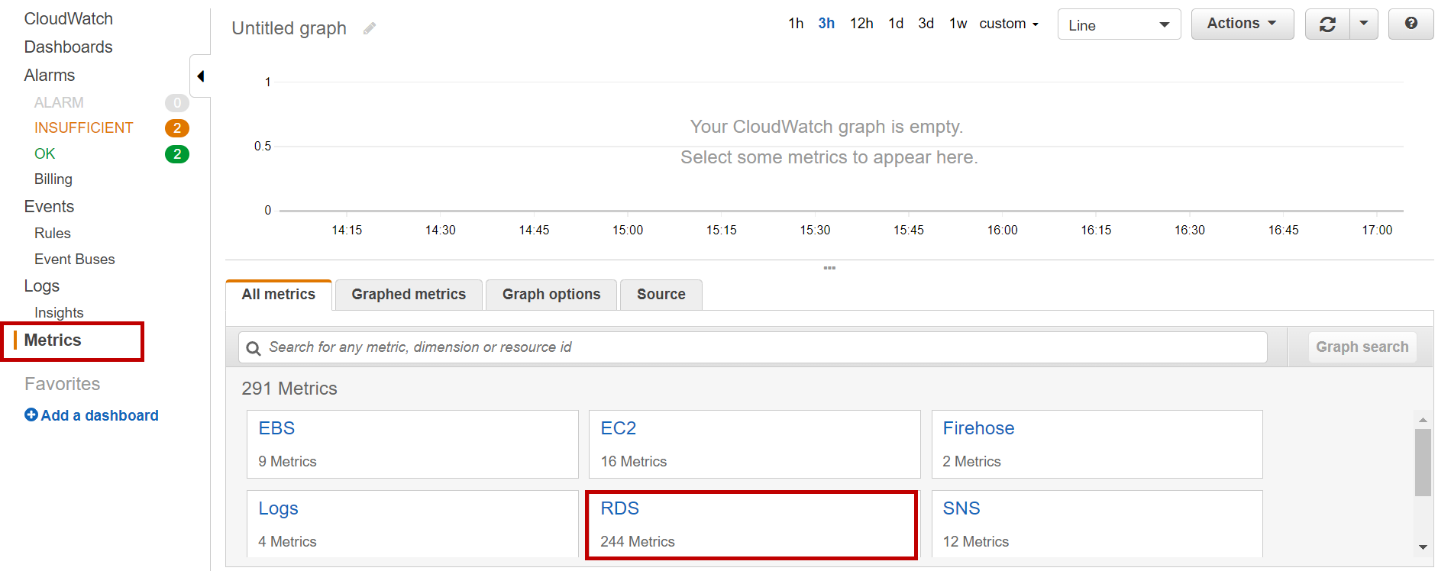
Alternatively, you can also view CloudWatch metrics by Navigating to CloudWatch page. Click on Metrics.
Click on RDS.
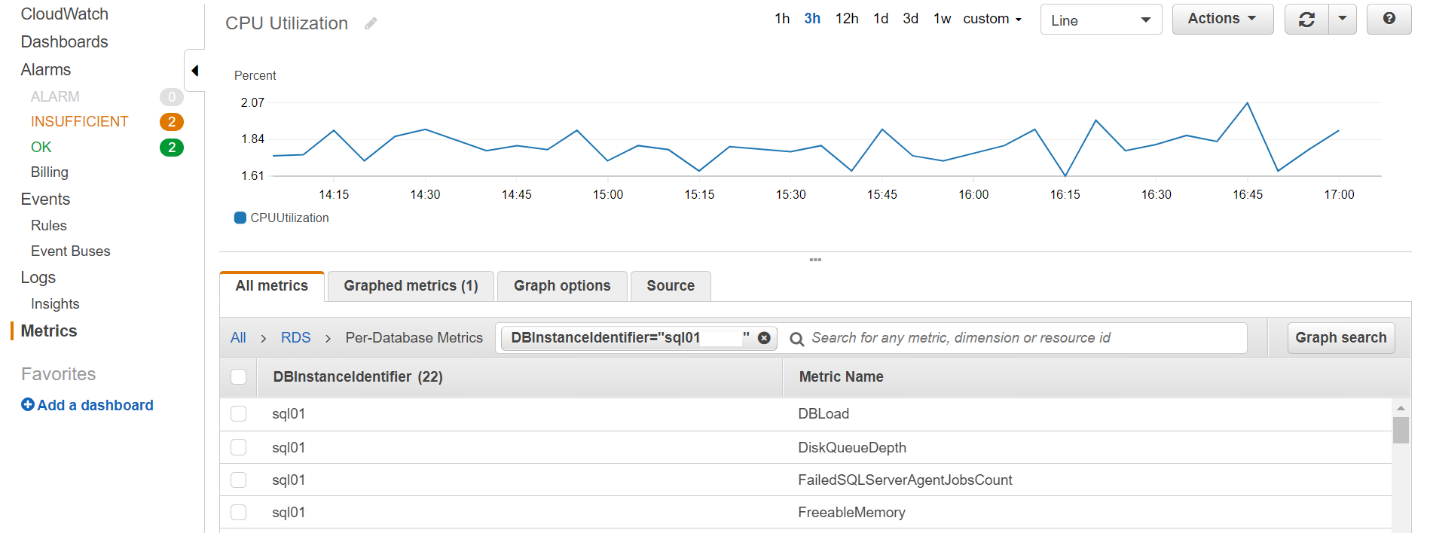
Select the dimension and the metric to view in the graph. You can select multiple metrics to show in the graph. You can also add this graph to the dashboard.
CloudWatch Alarms
The CloudWatch alarm will help us to monitor a metric over a period and notify us through email if the metric value reaches the threshold value you set.
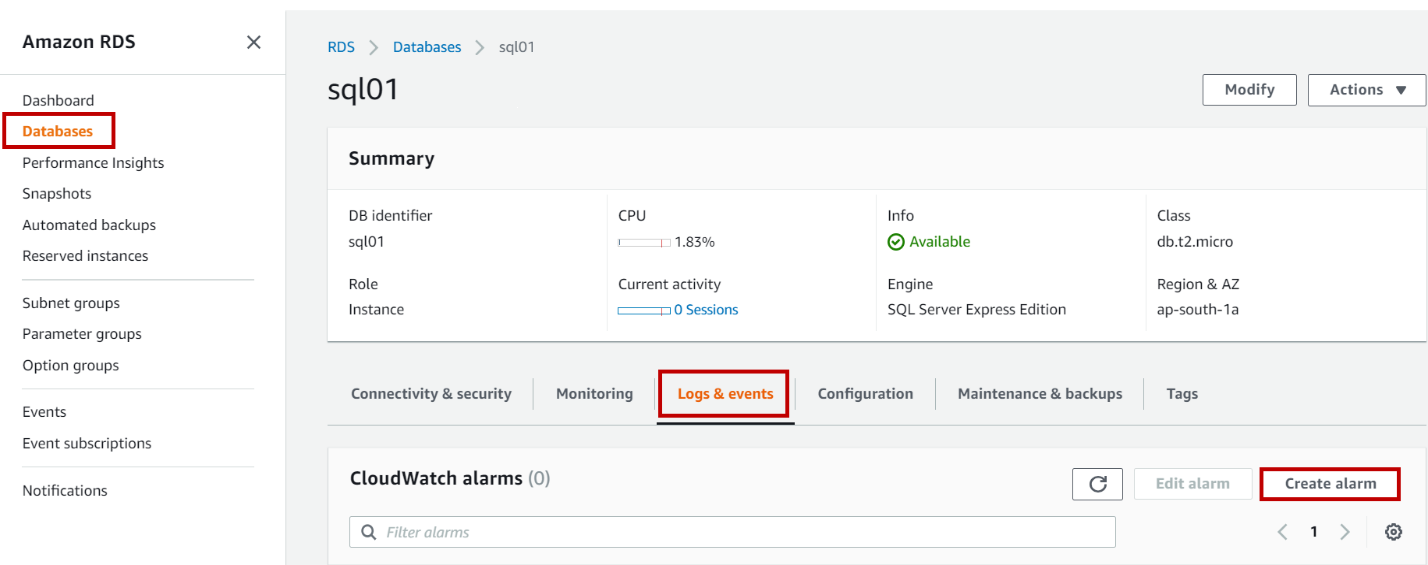
To create a CloudWatch alarm, Navigate to databases in AWS RDS SQL Server console. Click on the database instance and click on Logs and events. Click on Create alarm.
In Create alarm page, select Yes to send notifications and select the ARN if you already have one or create a new email or SMS topic.
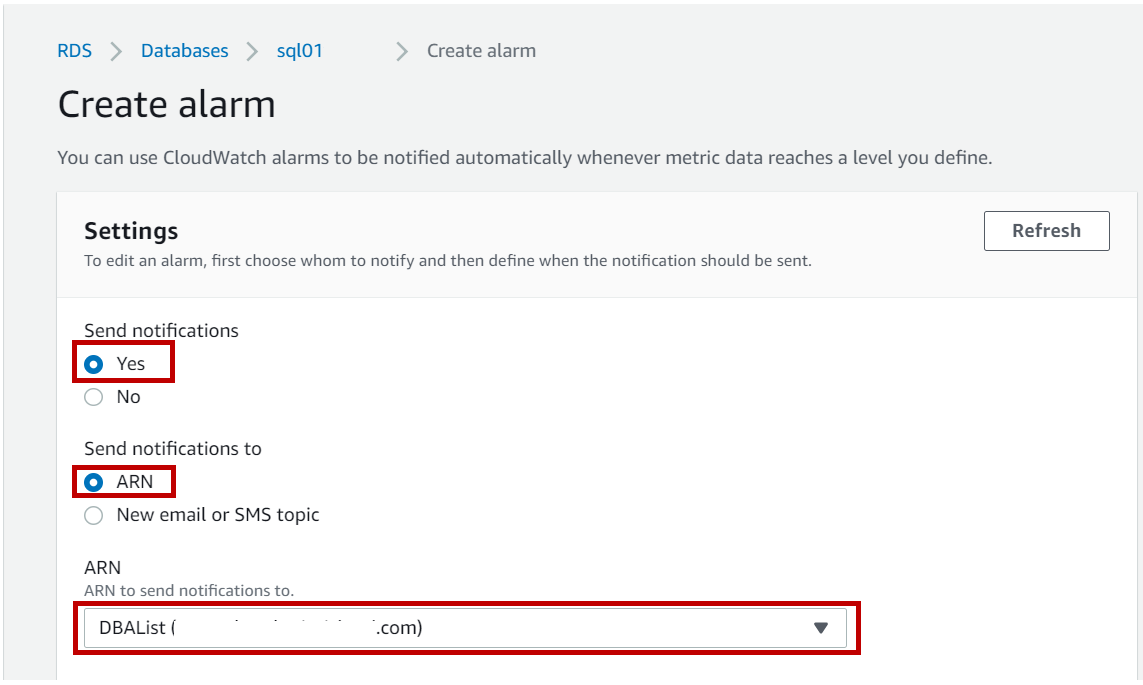
Choose the metric, evaluation period, threshold value and input the alarm name. Click on Create alarm.
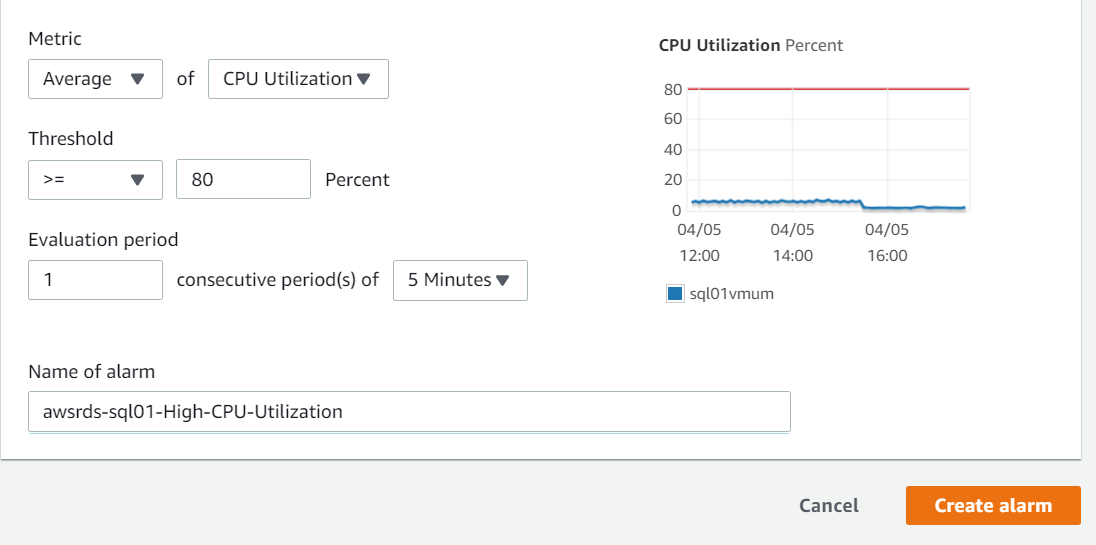
Once the alarm is created, click on view to navigate to CloudWatch alarm page where you can see the list of alarms created by you. We can modify, delete and add an alarm to a dashboard.
To add an alarm to the dashboard. Navigate to CloudWatch page and click on Alarms. Select the alarm you want to add to the dashboard and click on Add to Dashboard.
In the Add to dashboard popup, select the dashboard if you already have one else create a new one. Select the type of widget and give the name of the widget. Click on Add to the dashboard.
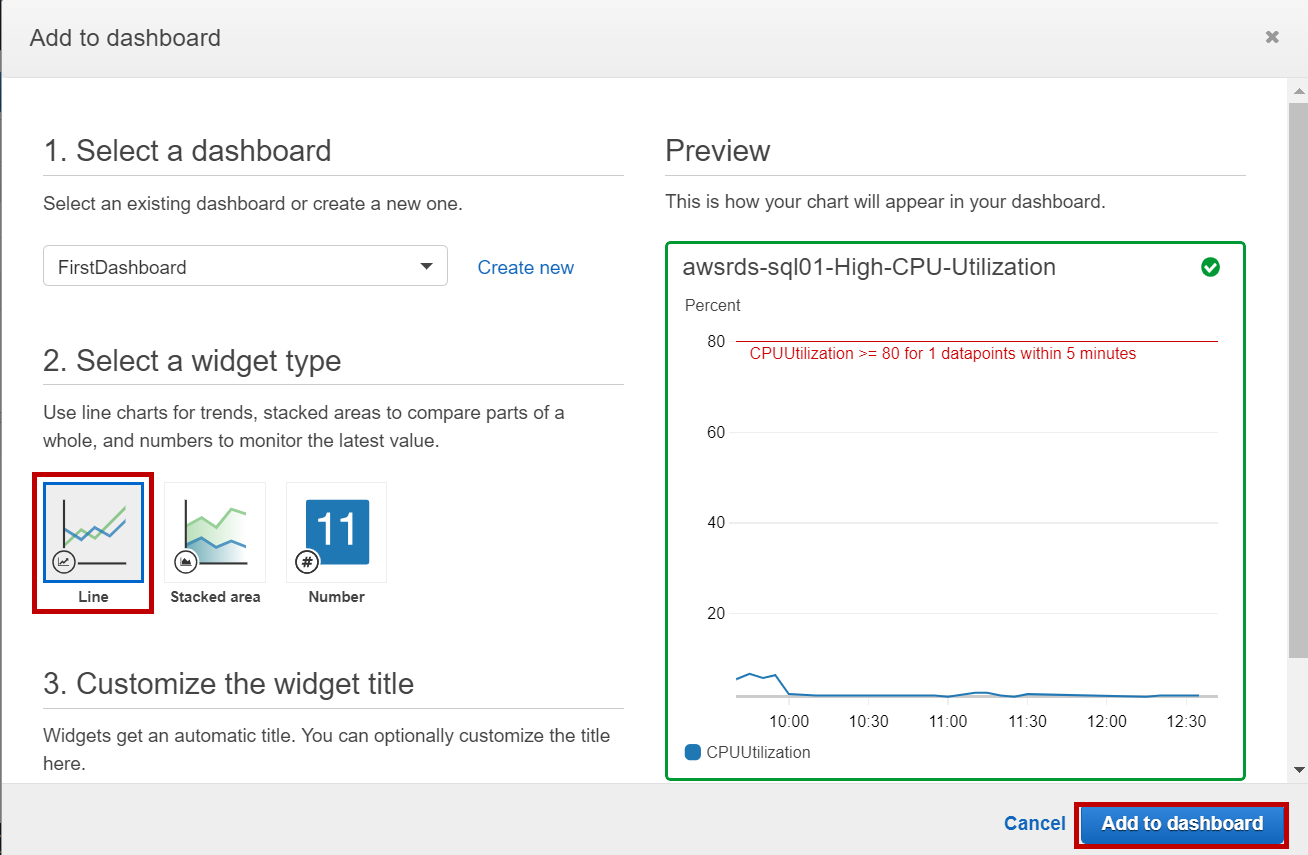
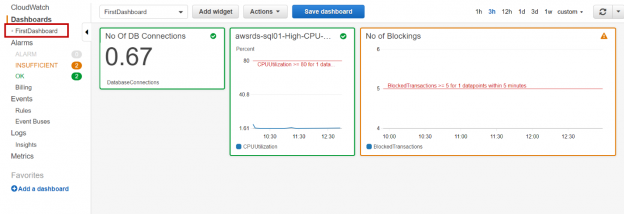
Now click on the dashboard name to navigate to the dashboard for a graphical view of all your alarms in one place.
The color of the alarm indicates the state of the alarm.
- Green – Ok
- Yellow – Insufficient data
- Red – Alarm state
Database log files
Database log files can be accessed from the AWS RDS SQL Server console. Navigate to databases in AWS RDS SQL Server console. Click on the AWS RDS SQL Server database instance and click on Logs and events.
You can view, watch and download the SQL server and SQL server agent logs. Alternatively, you can use the stored procedure “rds_read_error_log” to read the log file. The retention period of these log files is 7 days.
- Geo Replication on Transparent Data Encryption (TDE) enabled Azure SQL databases - October 24, 2019
- Overview of the Collate SQL command - October 22, 2019
- Recover a lost SA password - September 20, 2019

