This article will explore Azure automation for scaling up Azure SQL Databases based on the CPU usage threshold.
Introduction
In the article, Azure Automation: Auto-scaling Azure SQL database with Azure Logic Apps, we explored Azure logic apps for scaling resources based on a fixed schedule. In many cases, if we do not have planned activities, we require scaling resources based on resource consumption. For example, if CPU usage of the Azure server crosses 90% for 5 minutes, we want to scale up the pricing tier to the next level. In case our Azure pricing tier is Basic. Therefore, it scales up to Standard S1.
This article uses the Common Alert Schema(CAS) for the Azure monitor. Let’s understand about in the upcoming section.
Common Alert Schema (CAS) for Azure Monitor
The common alert schema (CAS) standardizes the alert notification schema for the Azure monitor. Any alert received describes the following parts:
- The affected resource
- The alert cause
The common schema of the alert has the following sections:
- Standardized fields (essentials) are standard fields for all alerts. It gives alert metadata such as alert severity or description
- Alert context: The alert content varies depending upon the alert type
The Common Alert schema (CAS) uses a consistent JSON structure for alerts to integrate Webhook/Logic App/Azure Function/Automation Runbook for defining logics and their implementation. Refer to Microsoft docs for understanding CAS in more detail.
- Note: This article references Microsoft blogs for referencing the PowerShell scripts
Steps for automating scaling up resources for Azure SQL Database
This article assumes:
- You understand Azure SQL DB basics
- You have an active Azure database for scaling up resources
- You are aware of the pricing implications of cost for different pricing tiers
If you do not satisfy the above requirement, I advise you to refer to excellent SQL Azure articles on SQLShack.
Step 1: Create an automation account
In the Azure portal, search for automation accounts. As shown below, currently, I do not have any automation account under my subscription.
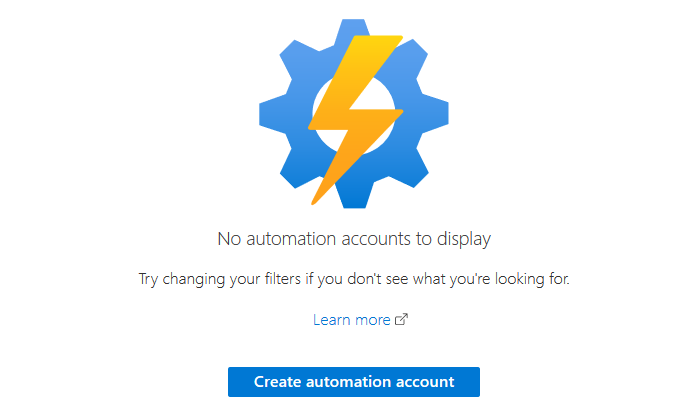
In the add automation account page, enter the following information:
- Automation account name
- Subscription
- Resource group
- Azure resource location
- Create Azure Run As account: Select Yes
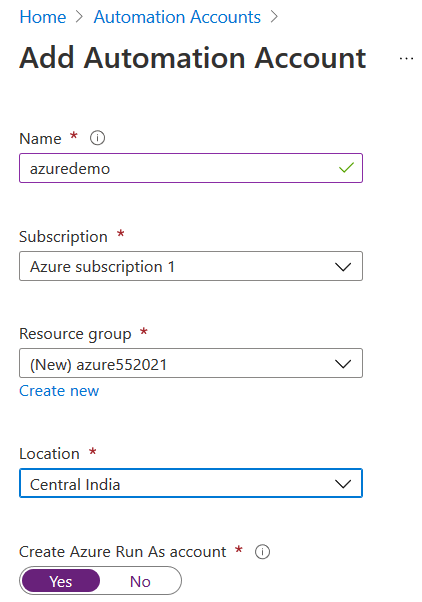
Once the azure automation account is created, you can view it under the automation account list.
Step 2: Import a runbook
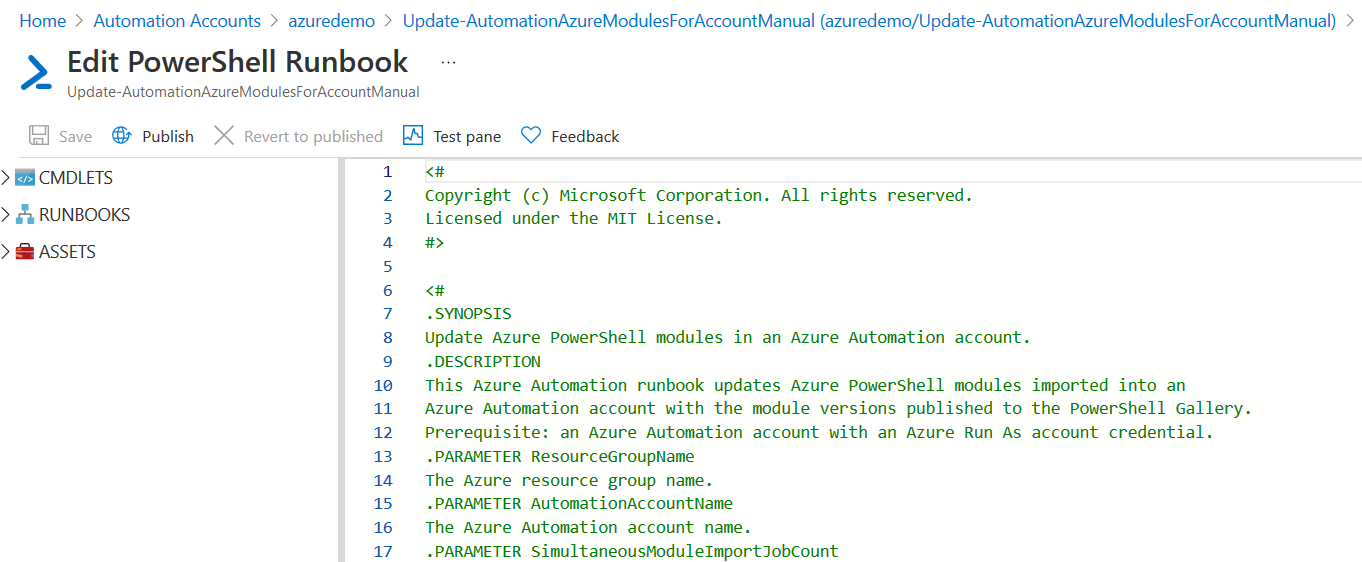
The runbook is a PowerShell script for automating things. In the Azure automation account, select runbook and import a runbook. For this step, navigate to GitHub, and download the Update-AutomationAzureModulesForAccount.ps1 in your local directory. Select the runbook file and click on create. It automatically fills the runbook name, type and description ( optional).
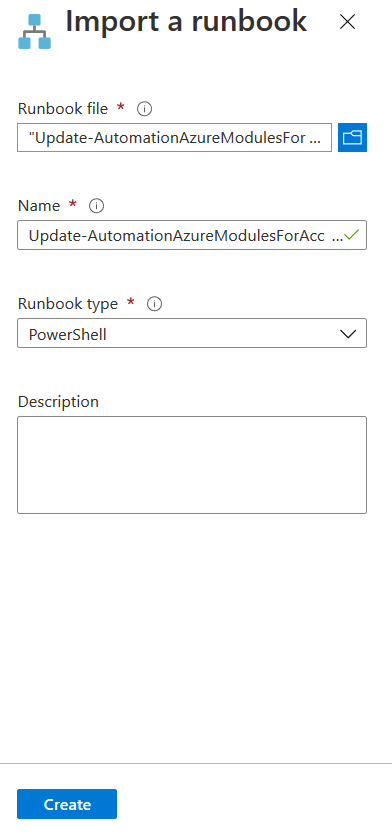
Click on Create, and it opens the PowerShell runbook editor, as shown below.
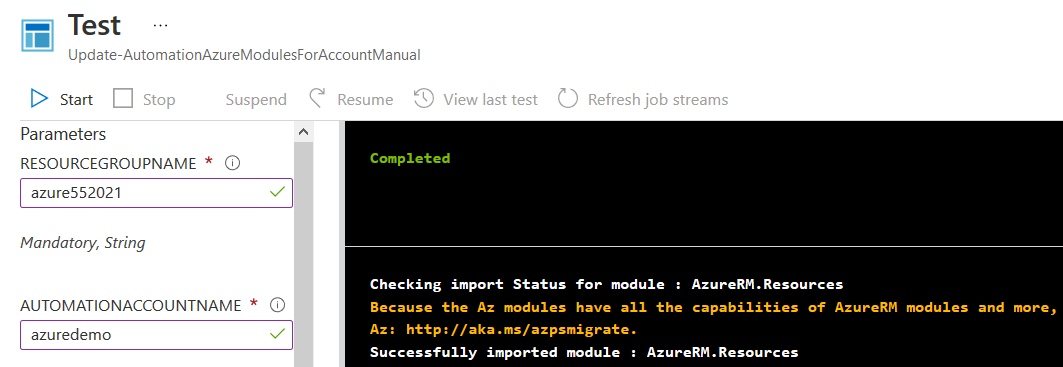
Click on Test Pane and enter the automation account name, resource group. Its status should be completed as shown below:
Step 3: create Auto Scaling runbook
In this step, we create a new runbook with logic for scaling up resources for Azure SQL Server. Click on New Runbook and enter the following information,
- Runbook name
- Runbook type: Select PowerShell from the drop-down
- description(optional)
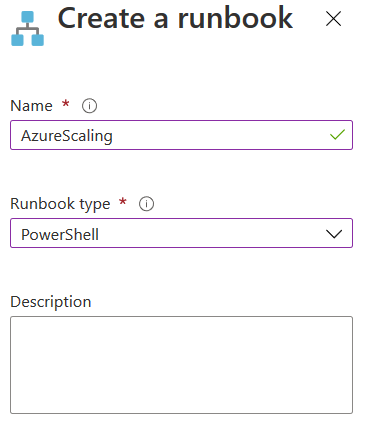
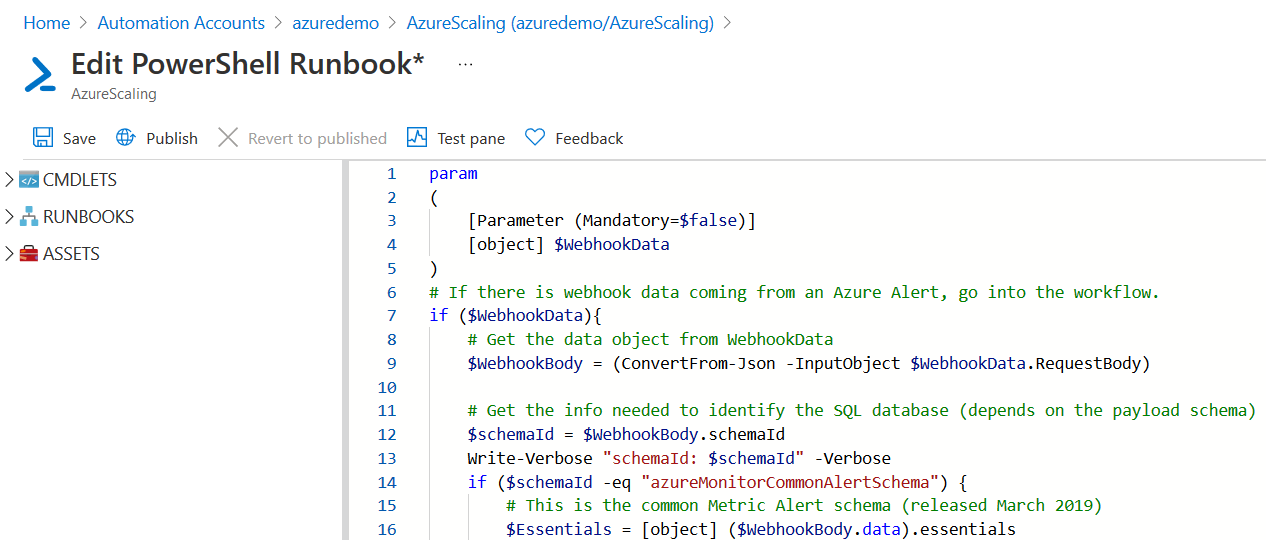
It opens the editing console for PowerShell Runbook. In this section, paste the script from the URL and save, publish the Runbook.
Step 4: Create Azure Monitor Alert to trigger the Automation runbook
In this step, we configure the Azure alert that will trigger the automation runbook execution. In the Azure SQL Database menu, search alerts. Currently, we do not have configured any alerts.
Click on Create alert rule. By default, it shows the azure database name in the scope section.
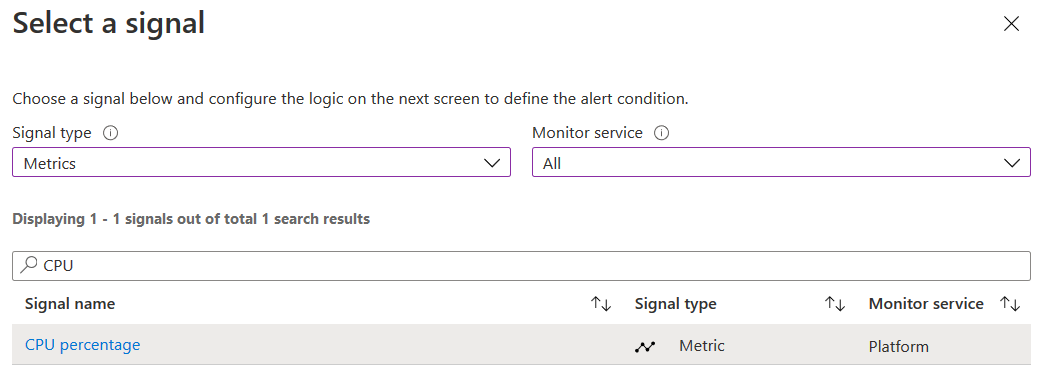
In the select a signal, section the following values.
- Signal type: Metrics
- Monitor service: All
- Signal name: CPU percentage
- Monitor service: Platform
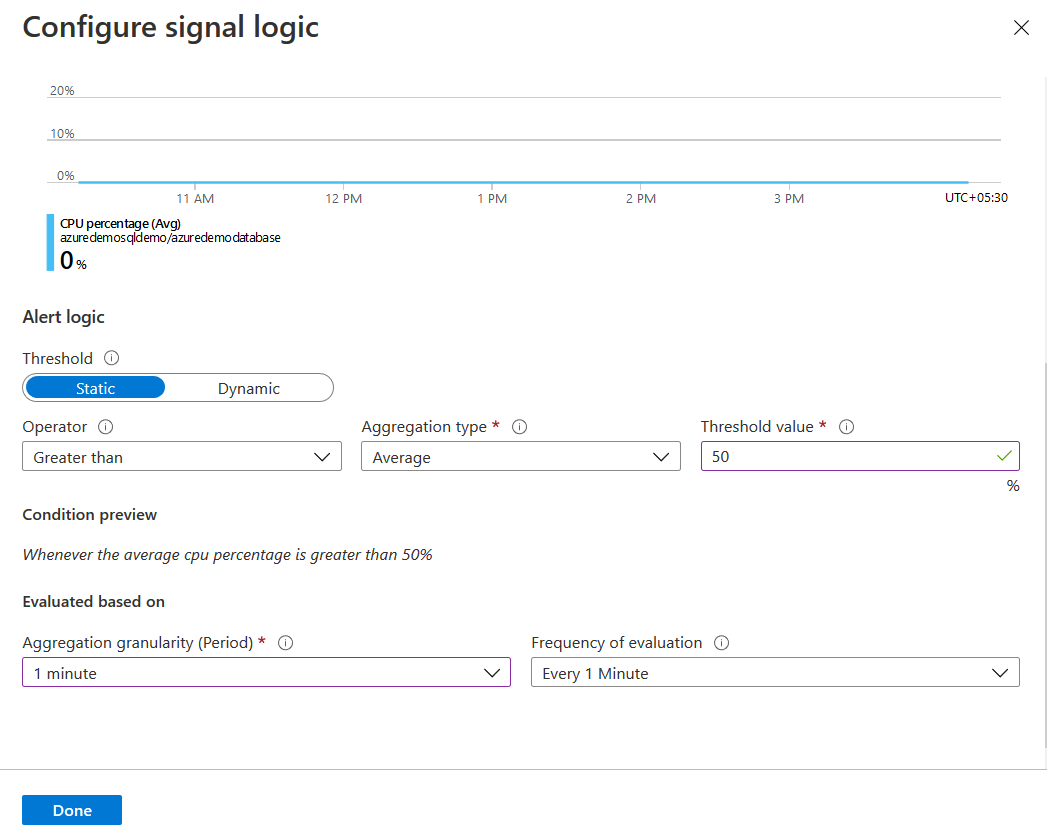
In the alert logic, you need to select the threshold that triggers the alert. For example, the below screenshot shows an alert whenever the average CPU percentage is greater than 50%.
In the evaluation, select the values for aggregation granularity (period) and frequency of evaluation.
Click on Done, and you can view the condition and its estimated monthly cost in USD.
In Actions, we define the notification or actions Azure takes once the alert rule triggers. For example, here, we define what steps Azure takes if the average CPU utilization is greater than 50% for a minute.
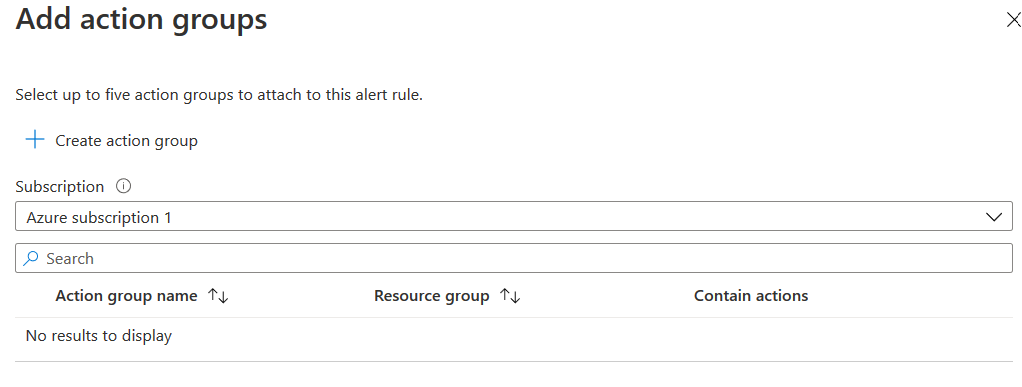
Click on Add actions groups and create an action group.
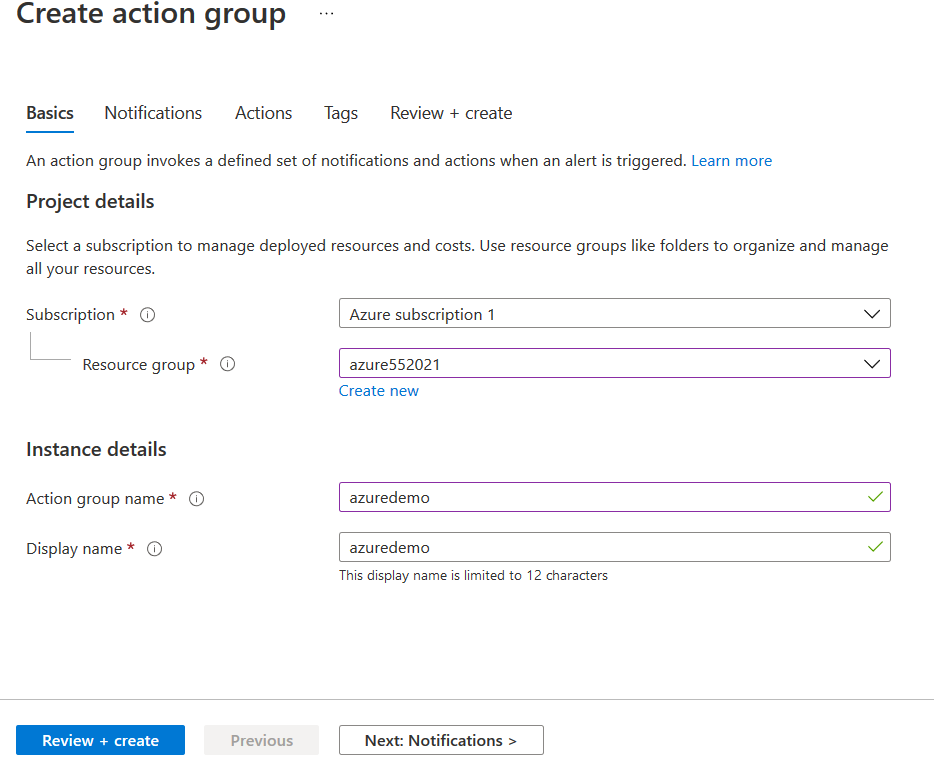
In the create action group, we have the following configurations:
Basic: Enter the subscription, resource group, action group name and display name
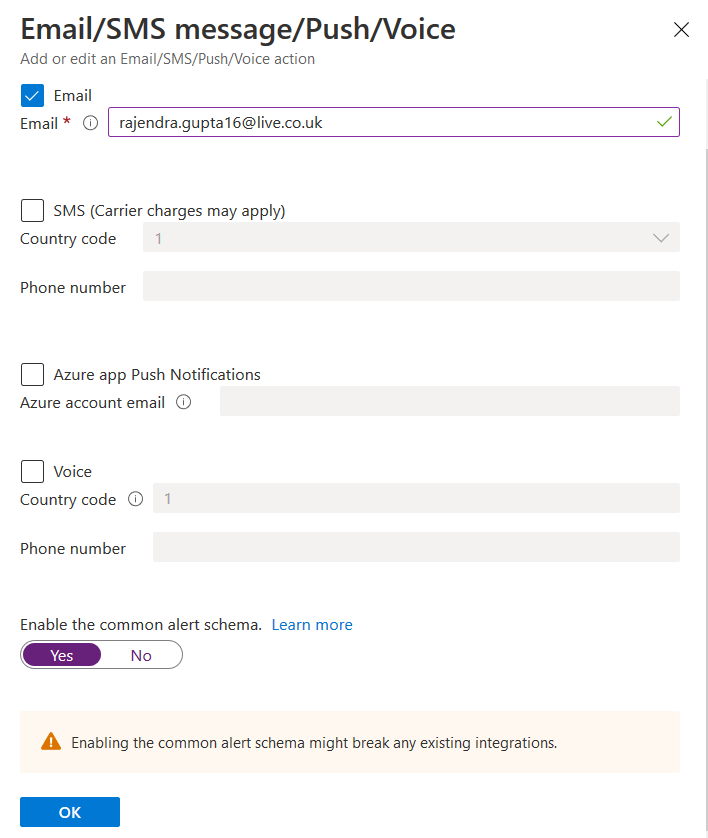
Notifications: In the notifications, select the notification type as Email/SMS message/Push/Voice. It opens another window for the configuration of notification. Here, enable the common alert schema as shown below:
In the email section, enter the email address for receiving alert notifications

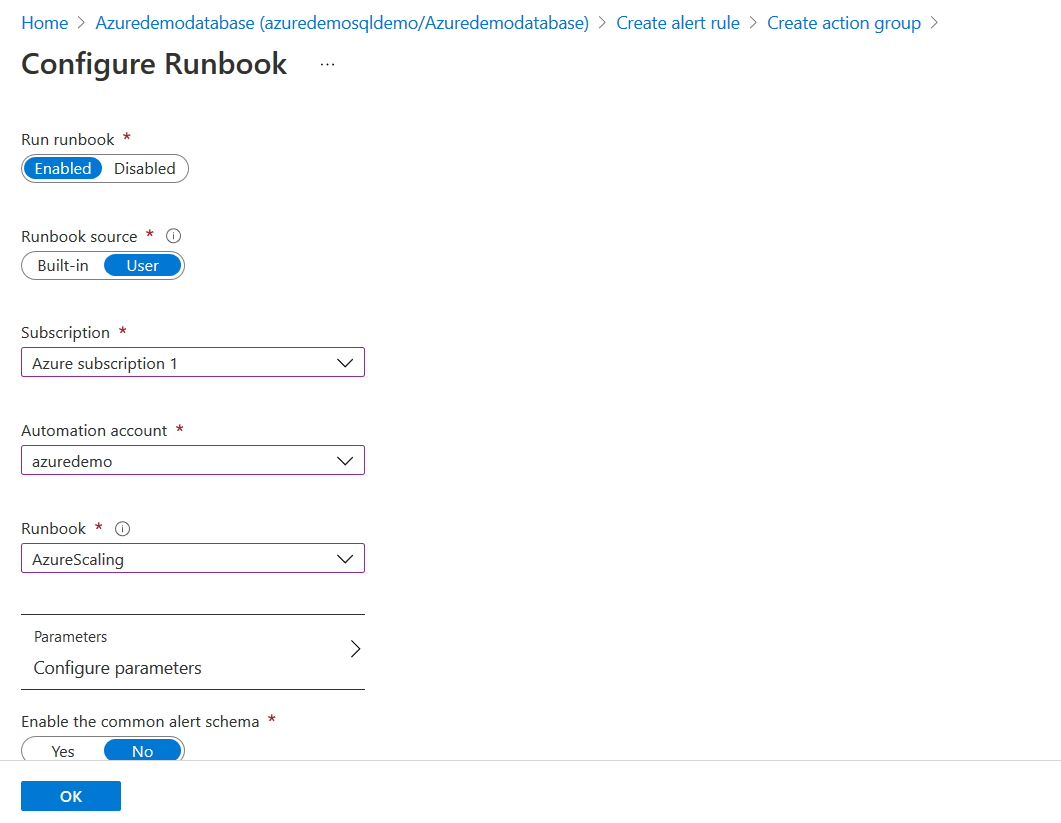
Actions: This section defines the actions after an alert generates for the Azure SQL database. In the configure runbook, enter the following values:
- Run runbook: Enabled
- Runbook source: User
- Subscription
- Automation account: Select the automation account name from the drop-down
- Runbook: Select the runbook that we want to execute for scaling up resources
- Enable the common alert schema: Select Yes
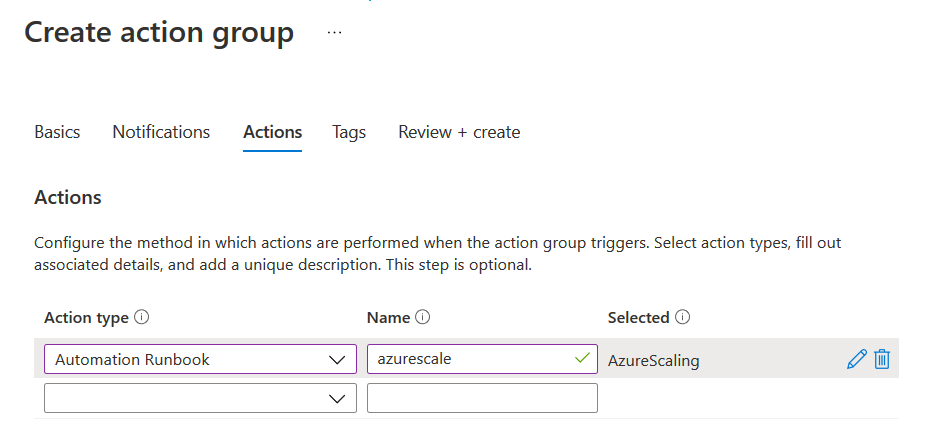
Click Ok, and you can view configured action type as Automation Runbook. Give a name for the action group
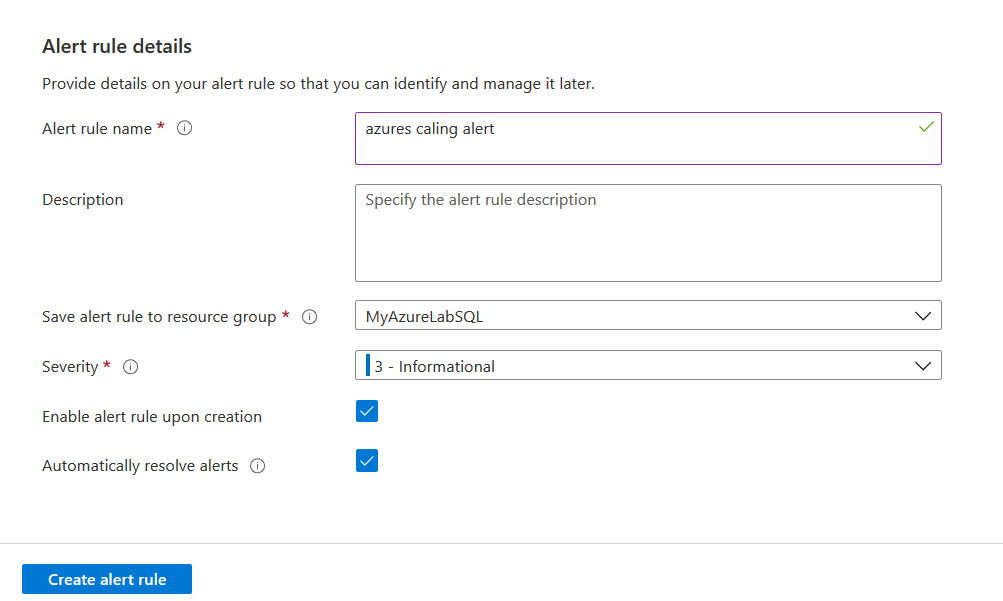
Alert rule details: In the alert rule details, enter the rule name, description, resource group, alert severity. You can also choose the option to resolve the alert if the counter value automatically goes below the threshold. For example, if the CPU comes down below 50% for a minute, an alert will be auto resolved
Click on Create alert rule. It takes around 5-10 minutes for the alert to be effective

Step 5: Validation
Until this point, we have configured an Azure SQL Database alert rule with enabled Common Alert Schema (CAS). Once an alert generates, it triggers the automation runbook execution based on the webhook received data.
Before we test the resource scaling up, verify the following things.
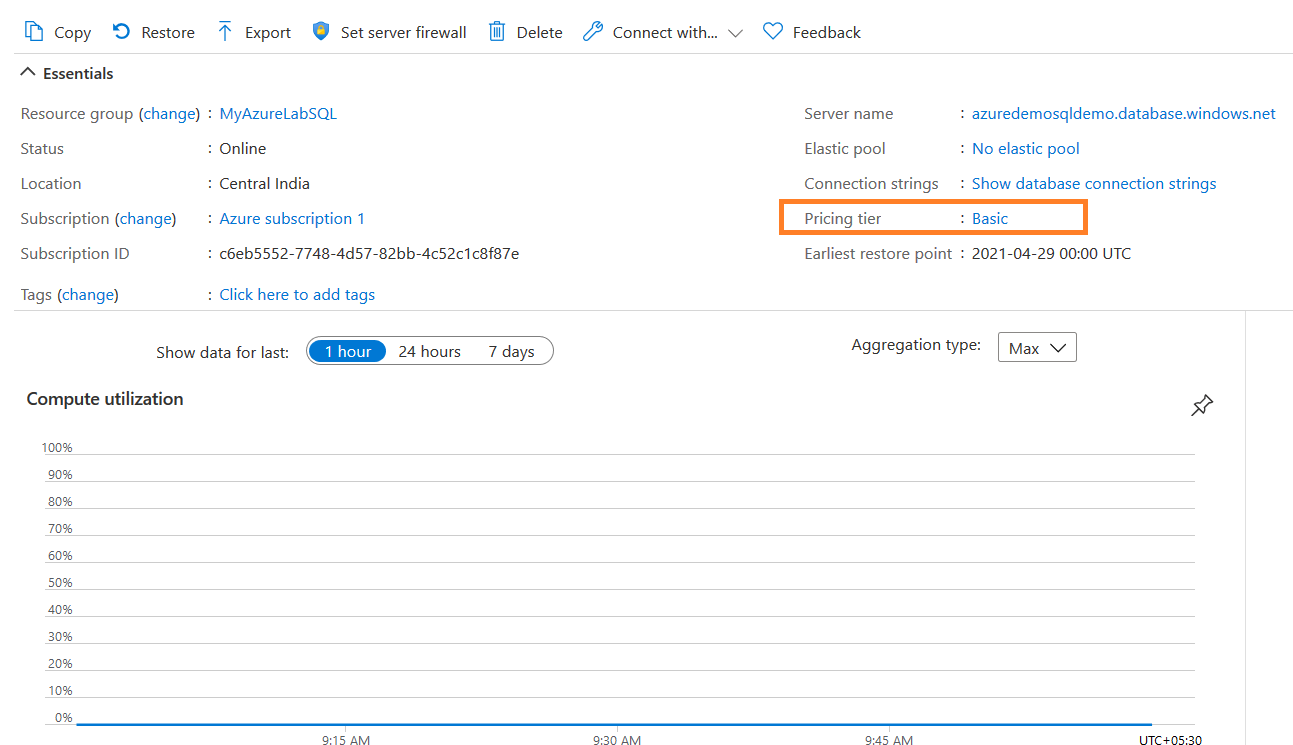
- Existing pricing tier as Basic
- CPU utilization – Normal
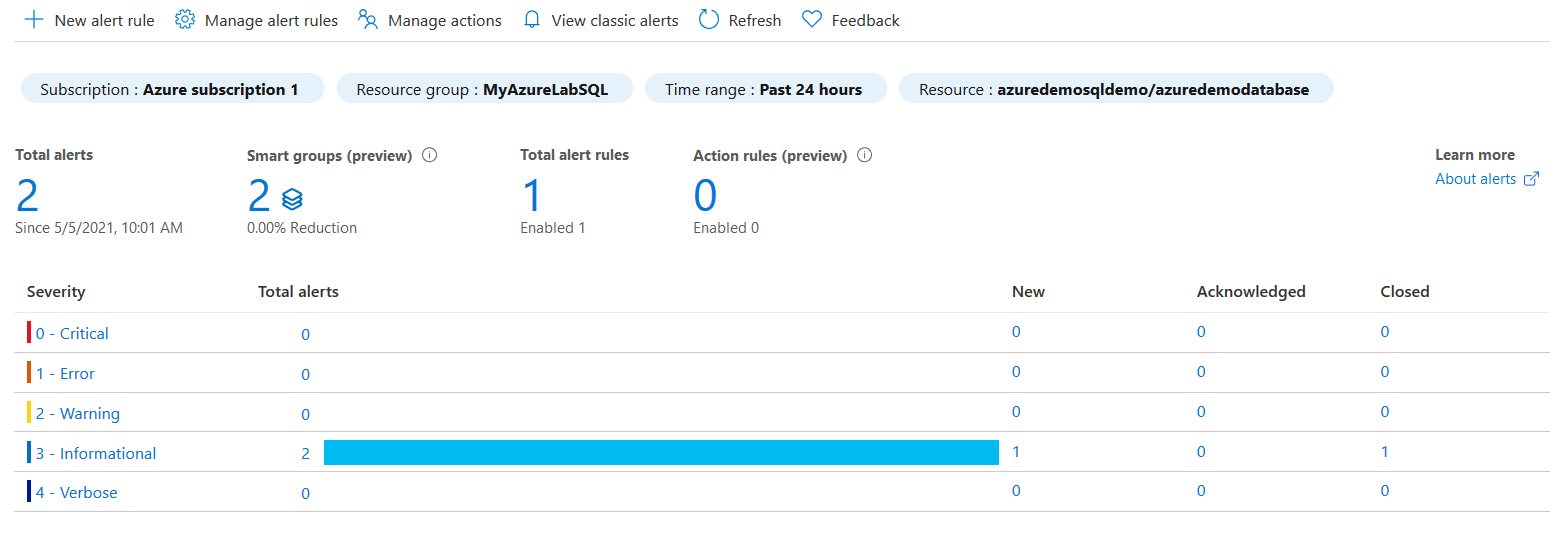
Click on Alerts in the Azure SQL Database menu. You see two existing alerts in the console.
Click on the Informational and the existing two alerts that are in the resolved state.
Let’s start a workload on the Azure database that triggers high CPU. For demonstration purposes, I lowered down the alert threshold to 10%.
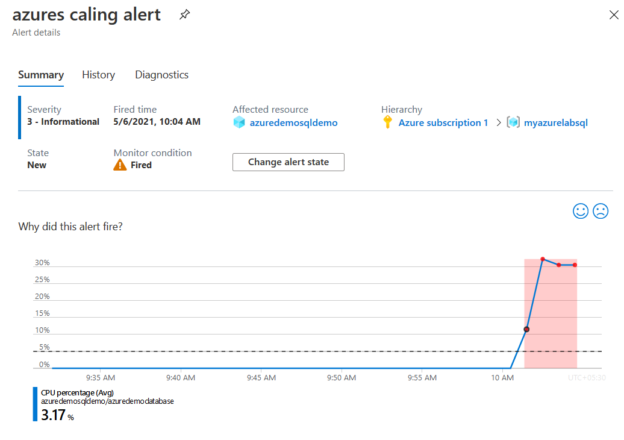
Now, refresh the console, and you see a new informational alert.
Click on the Informational, and it has a new fired monitoring alert.
To get more information, click on the alert, and you can see the following data.
- CPU utilization graph and metric points
- severity
- Alert fired time
- affected resource
- Monitor condition
Let’s validate the pricing tier of the Azure SQL Database. As we see below, it reflects the pricing tier as Standard S0: 10 DTUs. Azure Automatically scales up resources based on the threshold defined on alert and action groups.
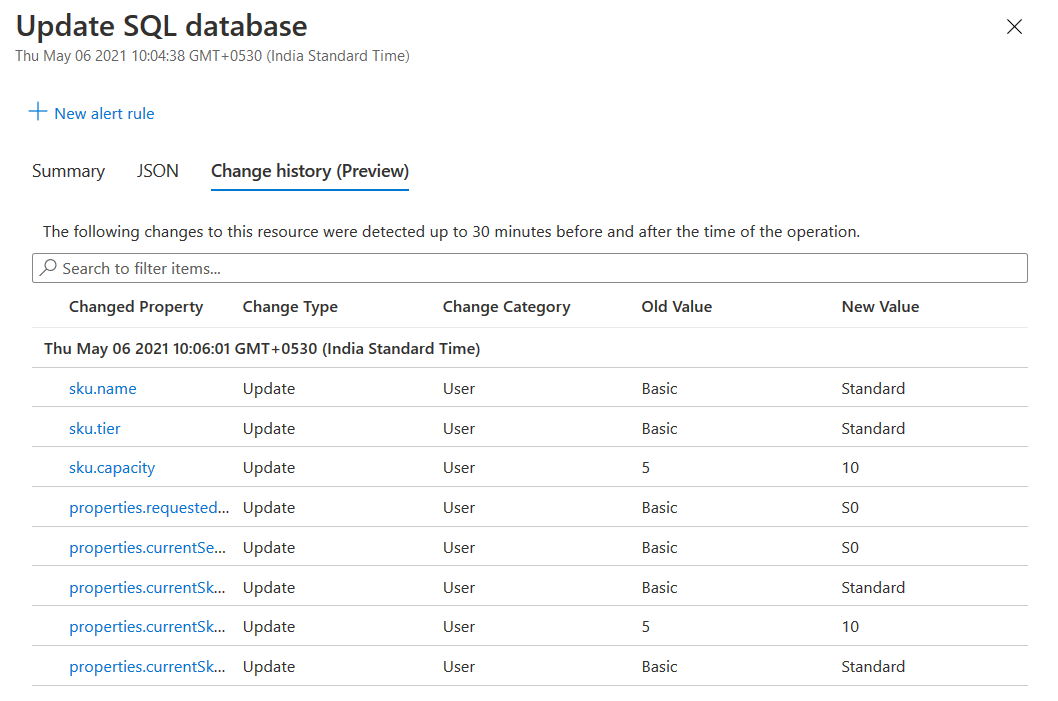
In the activity log of the Azure database, you can view logs for resources scaling up and down. You get an entry “Update SQL Database” in the logs.
Click on Update SQL Database and view change history. As shown below, it has changed the pricing tier from Basic to Standard S0.
Conclusion
This article explored the Azure automation process for automatically scaling up resources based on the CPU threshold. Similarly, you can embed a runbook to scale down resources if the workload counter value reduces below the CPU threshold.
It is advisable to tune your queries with indexes, statistics for optimized performance. Still, if you get high CPU usages, you can plan for automatically scaling, as shown in the article.
Table of contents
- Understanding PostgreSQL SUBSTRING function - September 21, 2024
- How to install PostgreSQL on Ubuntu - July 13, 2023
- How to use the CROSSTAB function in PostgreSQL - February 17, 2023

