This article explores various ways to use a Web data source in Power BI Desktop reports.
Read more »
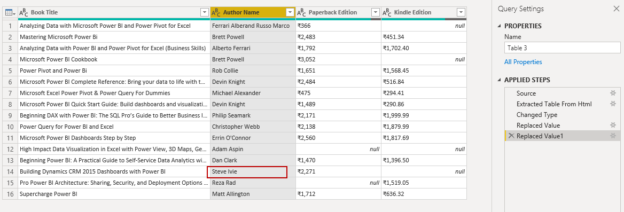
This article explores various ways to use a Web data source in Power BI Desktop reports.
Read more »
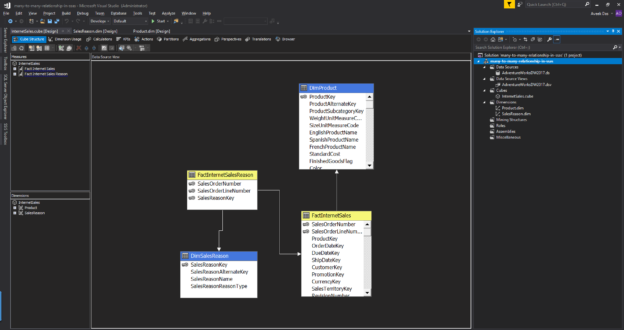
In this article, I’m going to explain what many-to-many relationships in SSAS are and how to implement the same in a SQL Server Analysis Services (SSAS) project. For the sake of this article, we will only consider the Multidimensional Cube and not the Tabular. Also, this article assumes that you have some fair knowledge of building SSAS cubes from scratch.
Read more »
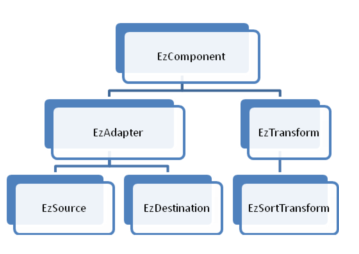
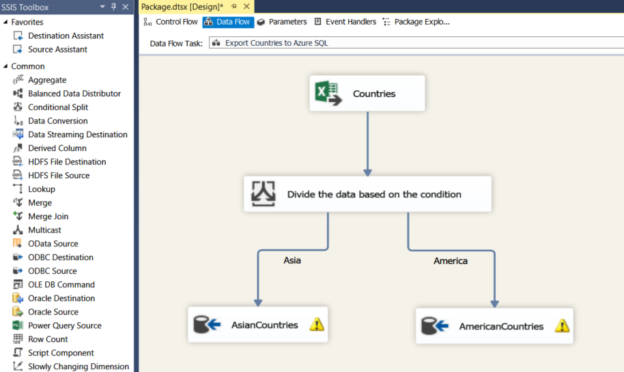
In the previously published article, Biml alternatives: Building SSIS packages programmatically using ManagedDTS, we talked about building SSIS packages using the managed object model of the SSIS engine (ManagedDTS). In this article, we will illustrate another Biml alternative, which is the EzApi class library, and we will make a comparison between both technologies.
Read more »
In the previously published articles in this series, we have explained how to use Biml to create and manage SQL Server Integration Services (SSIS) packages. In this article, we will talk about the first alternative of this markup language which is the Integration Services managed object model (ManagedDTS and related assemblies) provided by Microsoft.
In this article, we will first illustrate how to create, save and execute SSIS packages using ManagedDTS in C#, then we will do a small comparison with Biml.
Read more »
In the article, Python scripts to format data in Microsoft Excel, we used Python scripts for creating an excel and do various data formatting. Python is an interesting high-level programming language. You can go through various use cases of Python on SQLShack.
Read more »
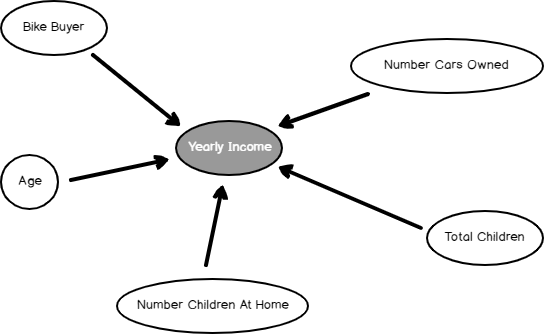
In this article, we will be discussing Microsoft Linear Regression in SQL Server. This is the next data mining topic in our SQL Server Data mining techniques series. Naïve Bayes, Decision Trees, Time Series, Association Rules, and Clustering are the other techniques that we discussed until today.
Read more »
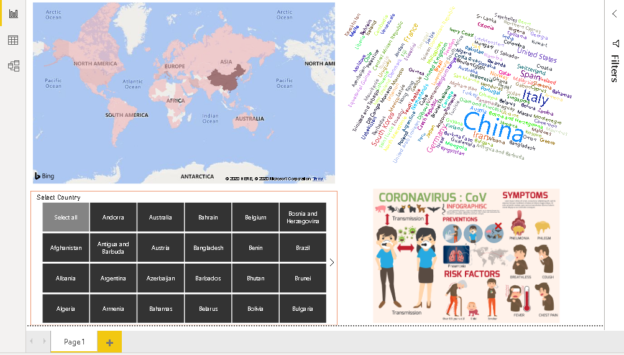
This article demonstrates Power BI visuals for visualizing Coronavirus impact worldwide using various visuals such as a filled map, Word Cloud, Slicer, Q&A.
Read more »
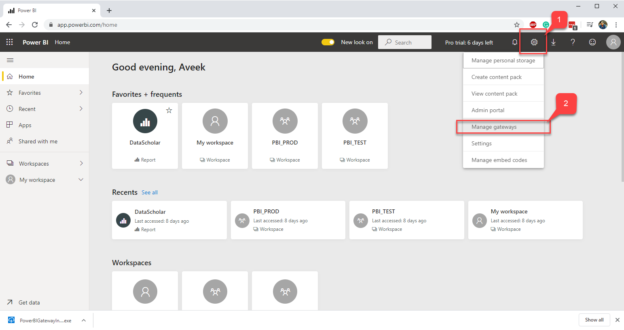
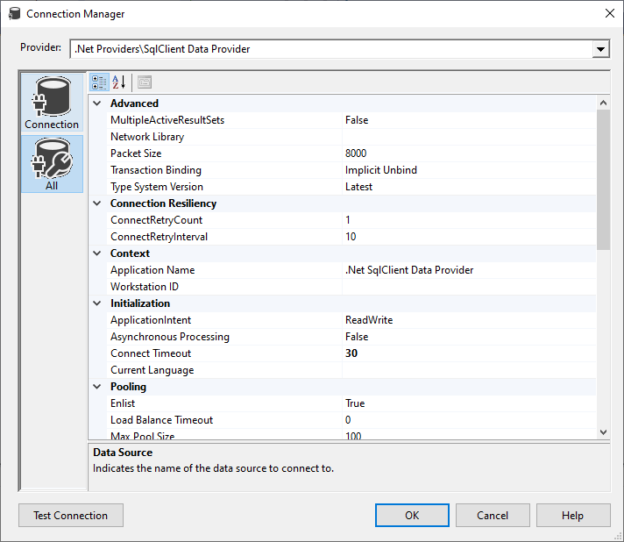
In this article, I’m going to explain what a Power BI Data Gateway is and how to set it up. I’ll also cover the underlying architecture that the gateway uses and how to manage on-premise data using the Data Gateway.
Read more »
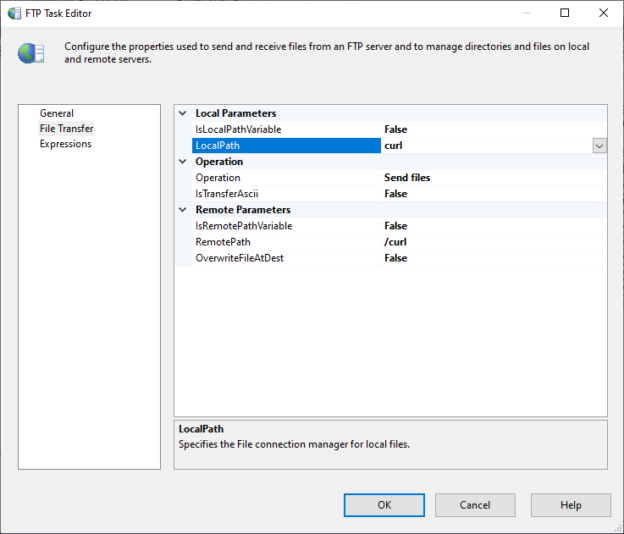
In this article, we will explain the File Transfer Protocol (FTP), and we will give an overview of the FTP task in SQL Server Integration Services (SSIS) and FTP connection manager.
Read more »
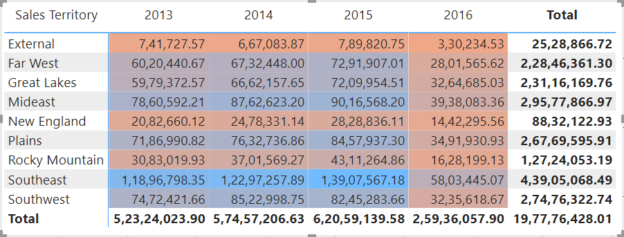
In this article, I’m going to explain what conditional formatting in Power BI is. Conditional formatting, as the name suggests, is a way of visualizing data that applies special format rules based on some pre-defined conditions on the values of a selected metric. It is mostly used when the data is presented in a tabular format; however, it can also be used in any charts such as bar charts, line charts, etc.
Read more »
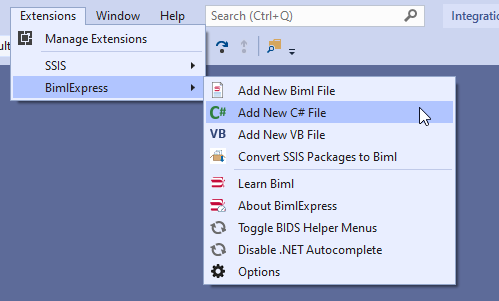
In the previously published article, Extending Biml with C# scripts, we have explained how to use VB or C# scripts within the Biml code to prevent doing repetitive development work. But in this solution, the C# scripts and classes are only available within a single file while we may need to use them in many.
Read more »
In this article, I am going to explain how we can access the data from the Azure Blob Storage using Power BI. To do that, we are going to use the below tools:
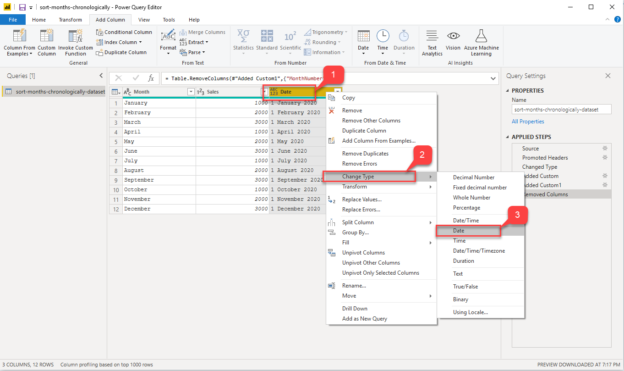
In this article, I’m going to demonstrate how to sort months chronologically in Power BI. Visualizing sales data in a time period is one of the most influential ways of reporting. Often, at times it is essential that you design charts that show the trend or growth of a metric over time. The time period can be anything for example days, weeks, months, or years. It basically gives you the idea of how the metric has increased or decreased over the specific period.
Read more »
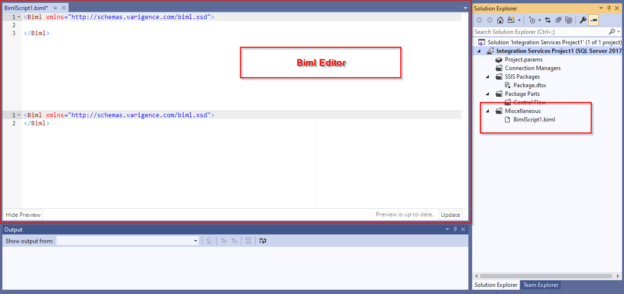
In our previously published articles in the Biml series, we have explained what Biml is, and how to use this language to generate SQL Server Integration Services (SSIS) packages. In this article, we will explain BimlScript, which is an extension of this markup language with VB or C# scripts.
Read more »
In the previous article, Converting SSIS packages to Biml scripts, we explained how to convert existing SSIS packages into Biml scripts using Import Packages tool and we mentioned that this could be an efficient way to learn this markup language since it lets the user compare between the well-known SSIS objects found in the package and the correspondent elements in the generated scripts.
Read more »
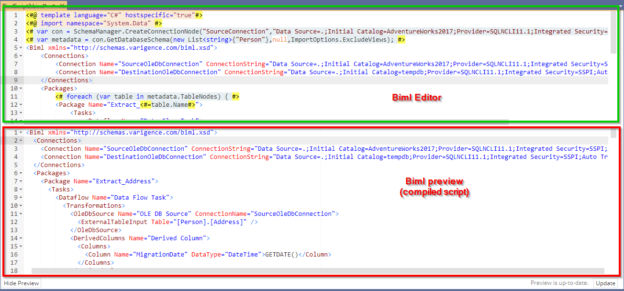
In our previous article, Getting started with Biml, we have explained what Biml is, what are the related tools and resources and how to get started with this technology. In this article, we will explain how to generate scripts from existing SSIS packages by showing all related options. Then, we will analyze the generated script and identify how each object is mentioned in the script.
Read more »
In this article, we will use Python scripts for data formatting in Microsoft Excel sheet with various examples.
Read more »
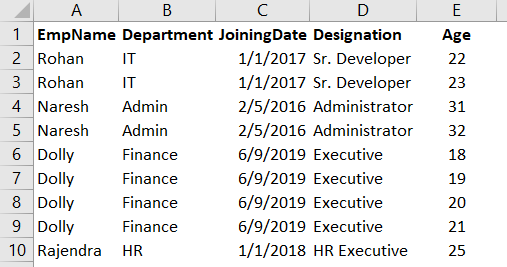
In this article, you will see how to implement a star schema in Power BI. Microsoft Power BI is a business analytics tool used to manipulate and analyze data from a variety of sources.
Read more »
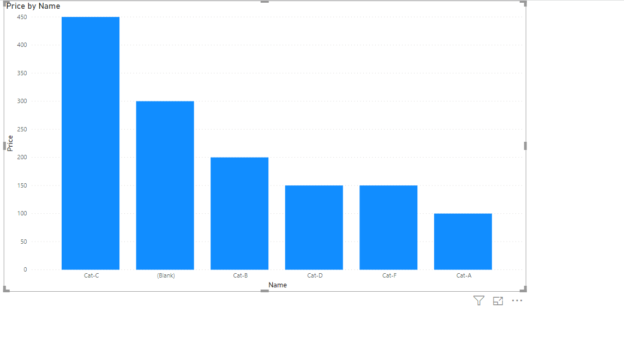
In this article, we look at how to create different types of relationships between two or more tables in the Power BI data model.
Read more »
T-SQL (Transact-SQL) is a set of SQL language programming extensions developed by Sybase and Microsoft. These extensions are adopted in Microsoft SQL Server and it provides a powerful set of functions to execute analytics and administrative commands; also it is very helpful during data wrangling.
Read more »
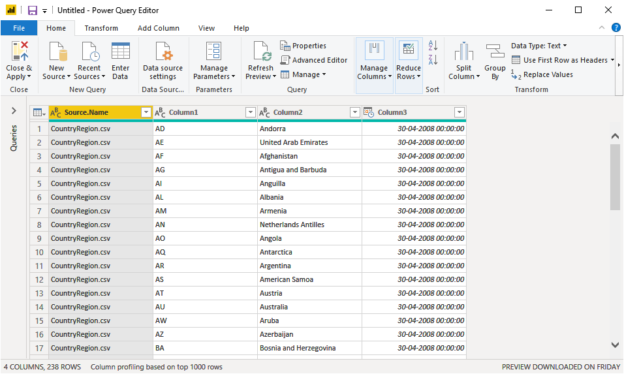
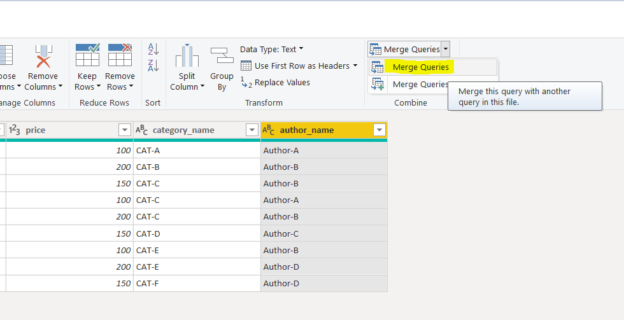
Power BI is a data analytics tool developed by Microsoft used to visualize data and find useful insights. In this article, you will see how to work with the Query Editor in Power BI desktop. Power BI comes in various versions, i.e., Power BI Desktop, Power BI Service, Power BI Mobile, and Power BI Developer. Power BI desktop is the free version, and the query editor is available in all three versions.
Read more »
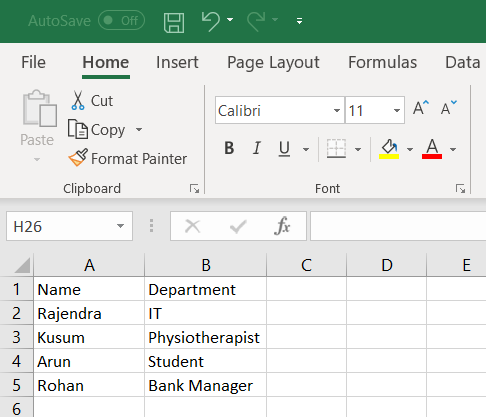
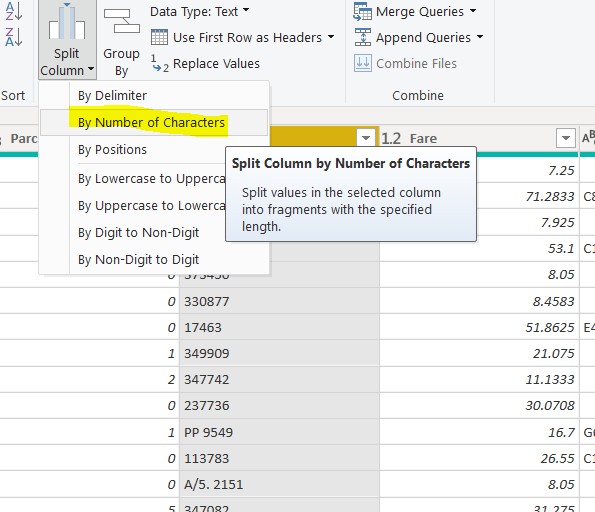
In this article, I am going to explain how we can split the data within the excel file and upload it to the tables created on the Azure SQL database.
Read more »
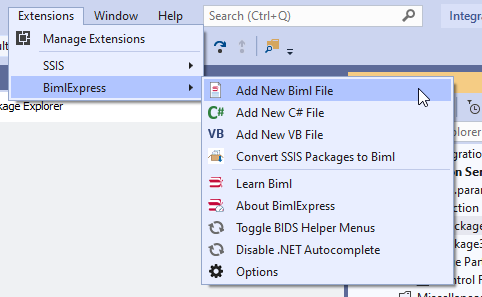
In this article, we will give a brief overview of BIML by showing how it can be installed and how we can use it to generate SSIS packages using the BimlExpress tool. Finally, we will provide some good resources to learn this technology.
Read more »
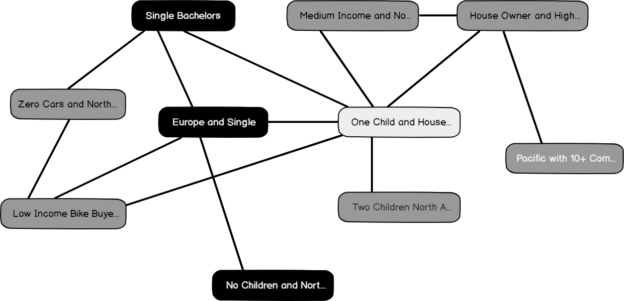
Microsoft Clustering is the next data mining topic we will be discussing in our SQL Server Data mining techniques series. Until now, we have discussed a few data mining techniques like: Naïve Bayes, Decision Trees, Time Series, and Association Rules.
Read more »
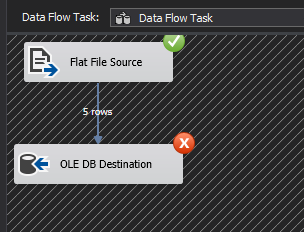
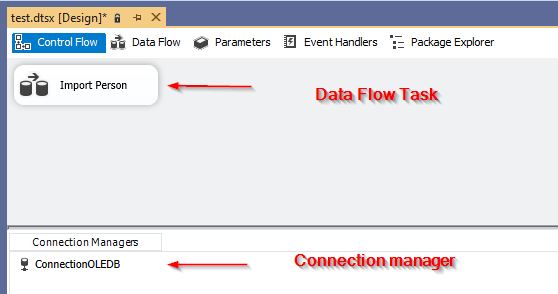
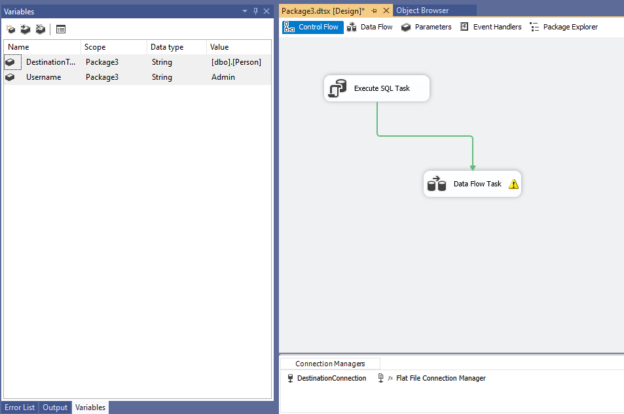
The Data Flow Task is an essential component in SQL Server Integration Services (SSIS) as it provides SSIS ETL developers with an ability to conveniently extract data from various data sources; perform basic, fuzzy to advance data transformations; and migrate data into all kinds of data repository systems. Yet, with all its popularity and convenience, there are instances whereby the Data Flow Task is simply not good enough and recently, I got to experience such inefficiencies. To demonstrate some of the limitations of SSIS’s Data Flow Task, I have put together a random list of Premier League’s leading goal scorers for the 2019-2020 season.
Read more »© 2025 Quest Software Inc. ALL RIGHTS RESERVED. | GDPR | Terms of Use | Privacy