Microsoft Power BI is a data analytics tool available in two flavors: Power BI Desktop and a Power BI Service.
Read more »
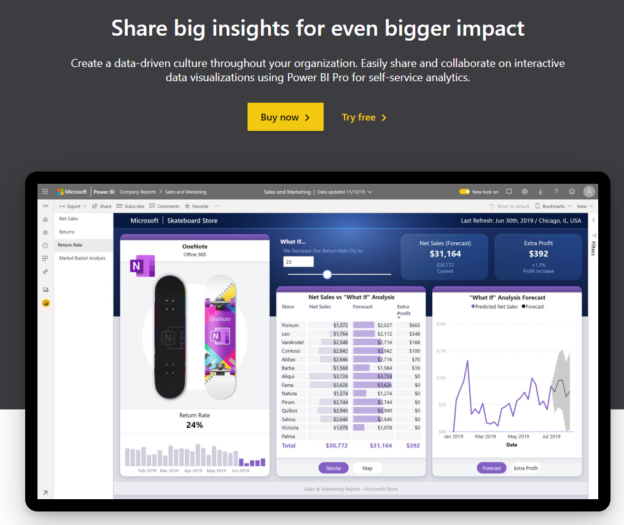
Microsoft Power BI is a data analytics tool available in two flavors: Power BI Desktop and a Power BI Service.
Read more »
In this article, you will see how to import data from JSON files and Power BI Rest API into the Power BI environment.
Read more »
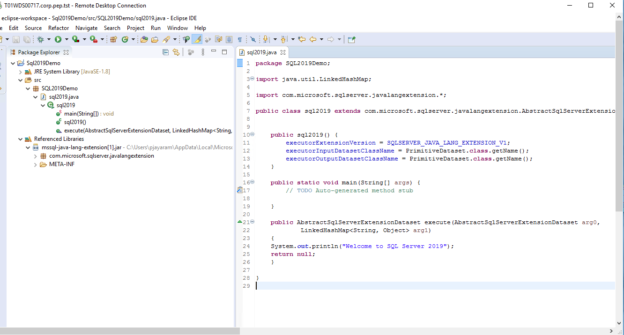
In this article, we will discuss SQL Server 2019 new feature—Java Language Extensions. With the advent of SQL Server 2019, Microsoft always strives to expand its footprint on the capabilities of MLS (Machine Learning Services). It builds a deeper integration between the data-platform and data science under the data science umbrella. The Microsoft SQL Server 2019 MLS extensibility framework provides a solid base for allowing extensions in R, Python, and now Java.
Read more »
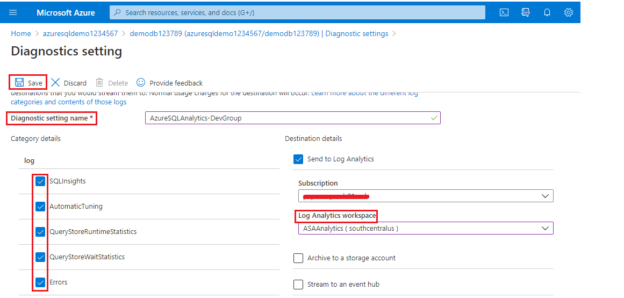
Using Azure SQL Analytics, you will rediscover the new ways to manage the Azure SQL Database. Microsoft is driving an intelligent platform to provide seamless collaboration for all their end users to business analysts, by building an effective Log Analytics stack and intelligent insight through dashboards.
Read more »
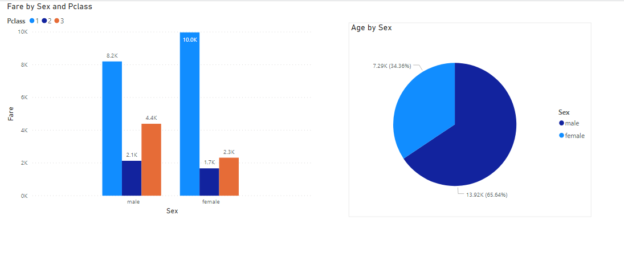
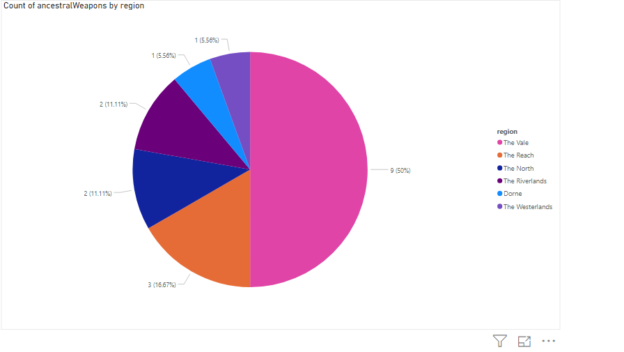
The Report View in Power BI can be used to create beautiful visualizations in Power BI.
Read more »
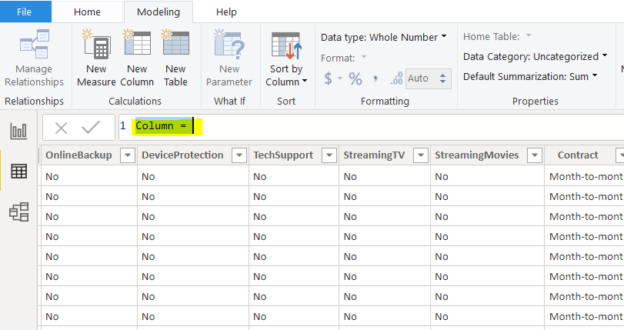
Microsoft Power BI supports two different languages, M language and DAX (Data Analysis Expression) that can be used to filter, manage, and visualize data.
Read more »
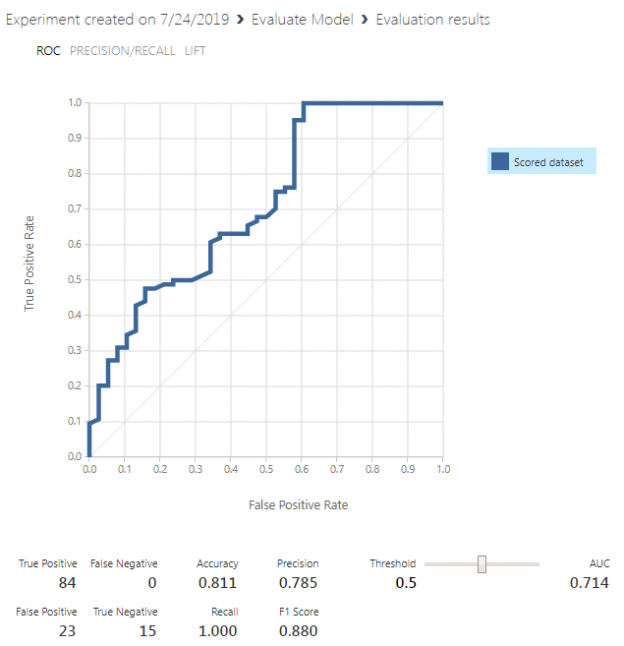
This article aims to provide the basics of creating Logistic Regression in Azure ML by designing a simple model step-by-step.
Read more »
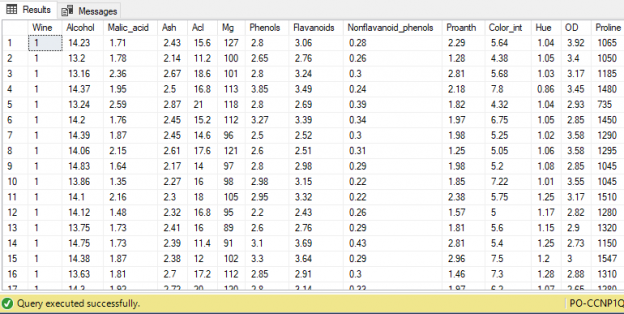
CSV (comma separated values) is one of the most popular formats for datasets used in machine learning and data science. MS Excel can be used for basic manipulation of data in CSV format. We often need to execute complex SQL queries on CSV files, which is not possible with MS Excel. See this article for what is possible with Power BI.
However, before we can execute complex SQL queries on CSV files, we need to convert CSV files to data tables.
Read more »
In this article, in the series, we’ll discuss understanding and preparing data by using SQL unpivot.
Read more »
In data science, understanding and preparing data is critical, such as the use of the SQL pivot operation. In this article, in the series, we’ll discuss understanding and preparing data by using SQL transpose and SQL pivot techniques.
Read more »
You might find the T-SQL GROUPING SETS I described in my previous data science article a bit complex. However, I am not done with it yet. I will show additional possibilities in this article. But before you give up on reading the article, let me tell you that I will also show a way how to make R code simpler with help of the dplyr package. Finally, I will also show some a bit more advanced techniques of aggregations in Python pandas data frame.
Read more »
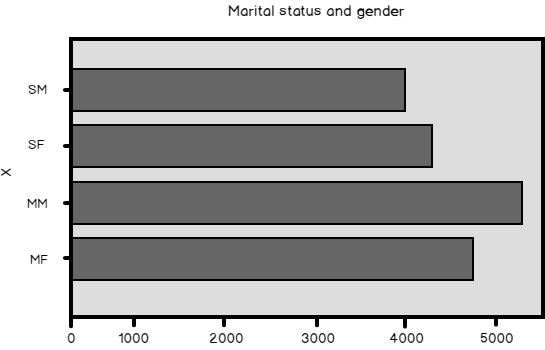
In data science, you analyze datasets. Datasets consists of cases, which are the entities you analyze. Cases are described by their variables, which represent the attributes of the entities. The first important question you need to answer when you start a data science project is what exactly is your case. Is this a person, a family, an order? Then you collect all of the knowledge about each case you can get and store this information in the variables.
Read more »
Previously, in this Data science series, I already tacitly did quite a few aggregations over the whole dataset and aggregations over groups of data. Of course, the vast majority of the readers here is familiar with the GROUP BY clause in the T-SQL SELECT statement and with the basic aggregate functions. Therefore, in this article, I want to show some advanced aggregation options in T-SQL and grouping in aggregations of data in an R or a Python data frame.
Read more »
In my previous four articles, I worked on a single variable of a dataset. I have shown example code in T-SQL, R, and Python languages. I always used the same dataset. Therefore, you might have gotten the impression that in R and in Python, you can operate on a dataset the same way like you operate on an SQL Server table. However, there is a big difference between an SQL Server table and Python or R data frame.
Read more »
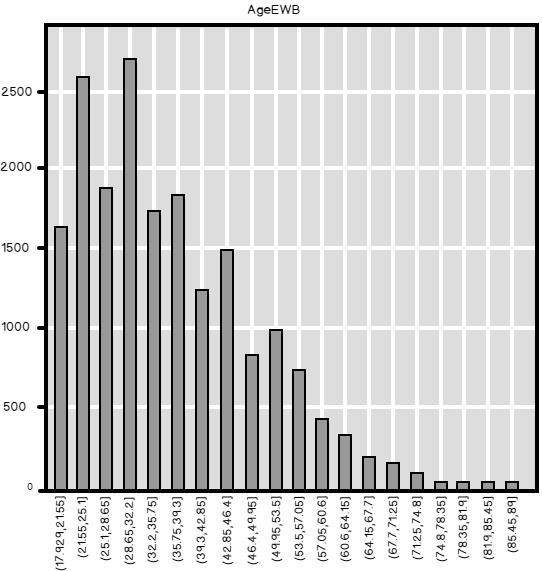
In this article, in the data science: data analysis and transformation series, we’ll be talking about information entropy.
Read more »
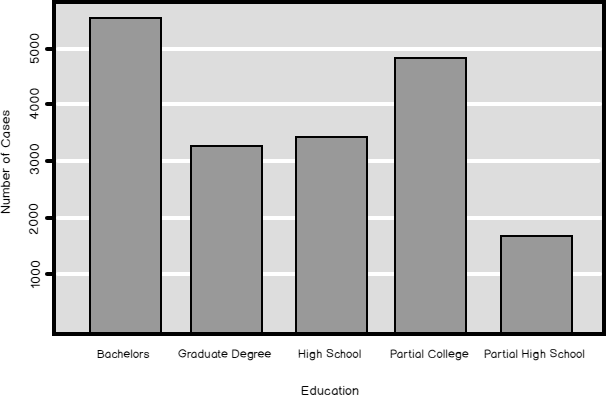
I started to explain the data preparation part of a data science project with discrete variables. As you should know by now, discrete variables can be categorical or ordinal. For ordinal, you have to define the order either through the values of the variable or inform about the order the R or the Python execution engine. Let me start this article with Python code that shows another way how to define the order of the Education variable from the dbo.vTargetMail view from the AdventureWorksDW2016 demo database.
Read more »
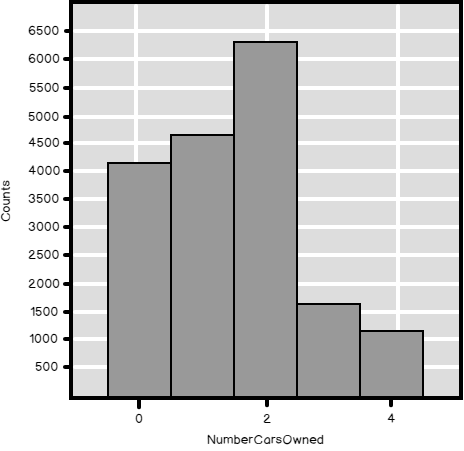
In my previous article, Introduction to data science, data understanding and preparation, I showed how to make an overview of the distribution of a discrete SQL variable. I analyzed the NumberCarsOwned variable from the dbo.vTargetMail view that you can find in the AdventureWorksDW2016 demo database. The data science graphs I created in R and Python and the histogram created with T-SQL were all very nice. Now let me try to create a histogram for another SQL variable from that view, for the Education variable. I am starting with R, as you can see from the following code.
Read more »
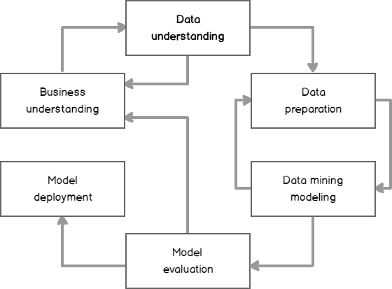
Data science, machine learning, data mining, advanced analytics, or however you want to name it, is a hot topic these days. Many people would like to start some project in this area. However, very soon after the start you realize you have a huge problem: your data. Your data might come from your line of business applications, data warehouses, or even external sources. Typically, it is not prepared for applying advanced analytical algorithms on it straight out of the source. In addition, you have to understand your data thoroughly, otherwise you might feed the algorithms with inappropriate variables. Soon you learn the fact that is well known to seasoned data scientists: you spend around 70-80% of the time dedicated to a data science project on data preparation and understanding.
Read more »
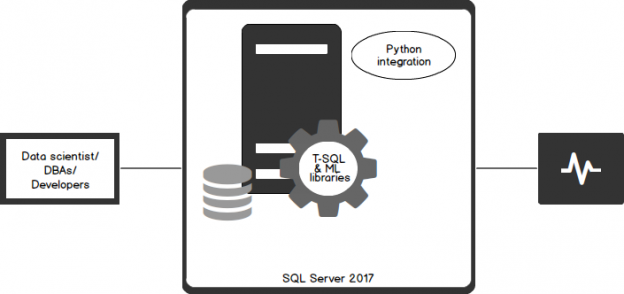
As a continuation to my previous article, How to use Python in SQL Server 2017 to obtain advanced data analytics, a little bit of curiosity about Deep Learning with Python integration in SQL Server led me to write this latest article.
With Python running within SQL Server, you can bring the existing data and the code together. Data is accessible directly, so there’s no need to extract query data sets, moving data from storage to the application. It’s a useful approach, especially considering issues of data sovereignty and compliance, since the code runs within the SQL Server security boundaries, triggered by a single call from T-SQL stored procedures.
Read more »
On the 19th of April 2017, Microsoft held an online conference called Microsoft Data Amp to showcase how Microsoft’s latest innovations put data, analytics and artificial intelligence at the heart of business transformation. Microsoft has, over the last few years, made great strides in accelerating the pace of innovation to enable businesses to meet the demands of a dynamic marketplace and harness the incredible power of data—more securely and faster than ever before.
Read more »
If you have been browsing job ads lately, you would have noticed a huge amount of positions available for Data Scientist. The demand seems to be much larger than the supply which means that there is a huge opportunity here. However, there appears to be a catch: Most of these positions requires some experience or knowledge in the field of Data Science. So if you want midway through your career, how can you skill up to become a Data Scientist?
Read more »© 2025 Quest Software Inc. ALL RIGHTS RESERVED. | GDPR | Terms of Use | Privacy