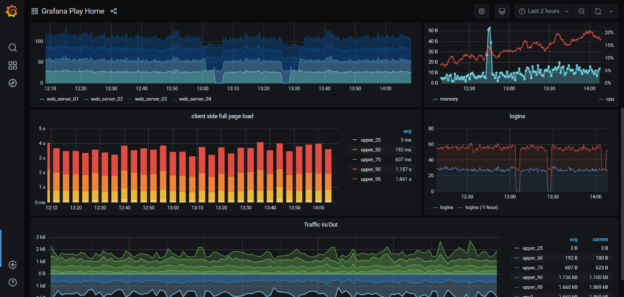
In this article, I am going to demonstrate how to set up Grafana Dashboard for real-time analytics or data monitoring purposes. Grafana is an open-source, cross-platform analytics service tool that can be used to fetch data from several data sources, and then the data can be visualized in a much intuitive way in the form of bars and graphs. This is quite a useful feature for the DevOps or the IT team as it can make their job easier to find abnormalities or spikes in the production environment by observing the logs generated.
Read more »