In this 37th article for SQL Server Always On Availability Groups, we will explore useful dynamic management views for monitoring availability replicas and databases.
Read more »
In this 37th article for SQL Server Always On Availability Groups, we will explore useful dynamic management views for monitoring availability replicas and databases.
Read more »
In this 36th article for SQL Server Always On series, we will explore various dynamic management views (DMV’s) for monitoring the AG replicas.
Read more »
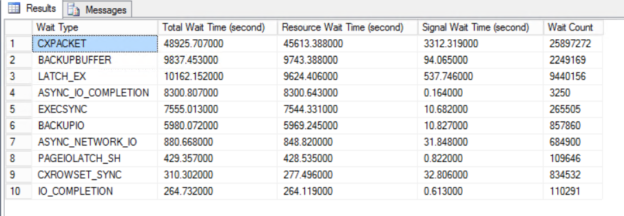
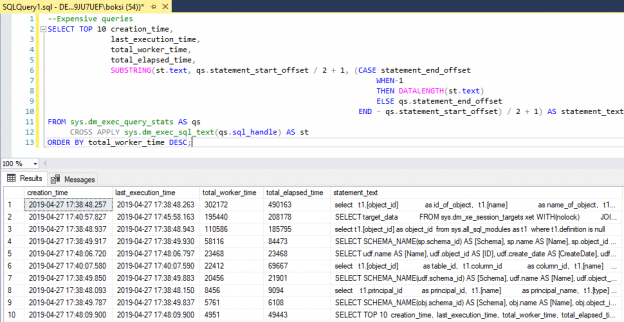
In this article, we will explore, how we can increase SQL Server performance with the help of the wait statistics. Wait statistics are one of the most important indicators to identify performance issues in SQL Server. When we want to troubleshoot any performance issue, at first we need to diagnose the problem correctly because correctly diagnosing problems help with half of the solution. Now, let’s learn wait statistics which helps to identify performance issues properly.
Read more »
In this 33rd article of SQL Server Always On Availability Group series, we will use extended events to monitor the availability group.
Read more »
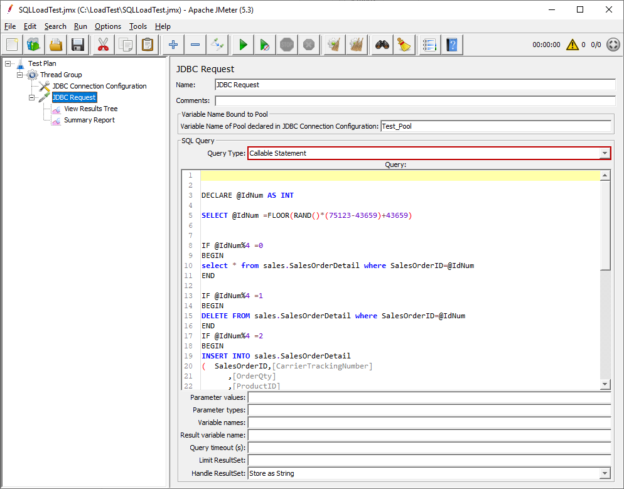
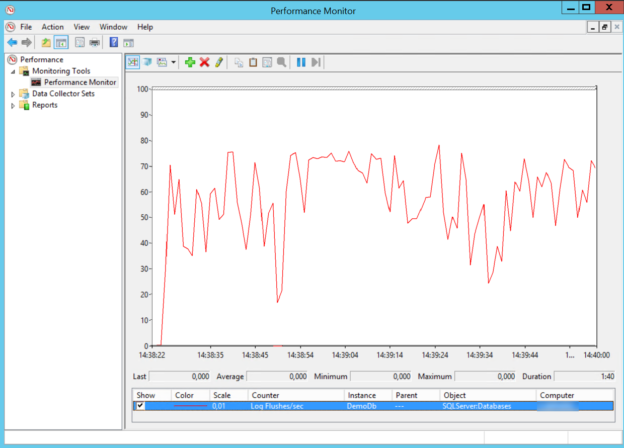
In this article, we will learn how to use Apache JMeter to perform a load test on SQL Server. This test type enables us to measure the application behaviors under specific conditions so that it enables us to observe a variety of resource consumptions (CPU, memory, latency, response times, etc) and it also helps to detect the performance bottlenecks. Database testing can help to find out and identify the problem when the database working under high workloads with multiple users. The database people can identify and fix the performance issues before publishing the database into the production through these tests.
Read more »
In this article, we will learn the Delayed Durability feature that helps to improve transaction log file write throughput in SQL Server.
Read more »
In this article, we will explore the method to suppress successful login and backups messages in the error log for SQL databases.
Read more »
In this article, we will learn some basic tips for SQL Server performance tuning. Tuning the SQL Server performance will help to access data faster so the applications data interaction performances will enhance.
Read more »
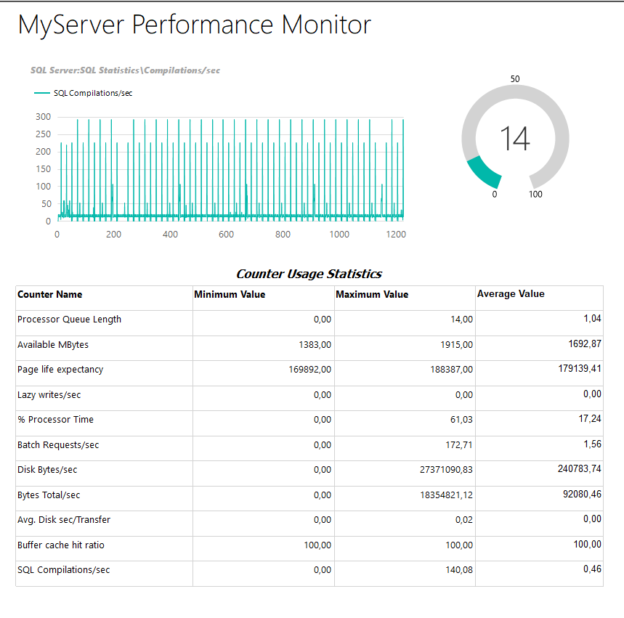
Performance Monitor is an oldie but goldie tool to analyze performance problems. In this article, we will learn how we can write Perfmon counter data to a SQL database through the ODBC connection.
Read more »

In this article, we will discuss how to resolve I/O problems that is a very important point for the SQL Server troubleshooting. The storage subsystem is one of the significant performance factors for the databases. Detecting and identifying I/O problems in SQL Server can be a tough task for the database administrators (DBAs). Generally, the underlying reasons for the I/O problems can be:
Read more »
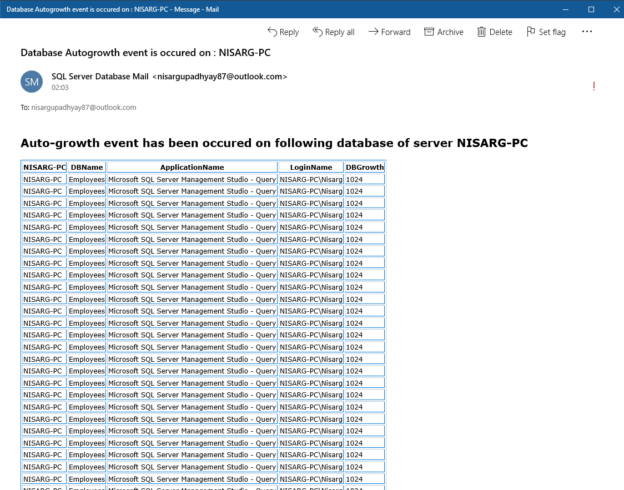
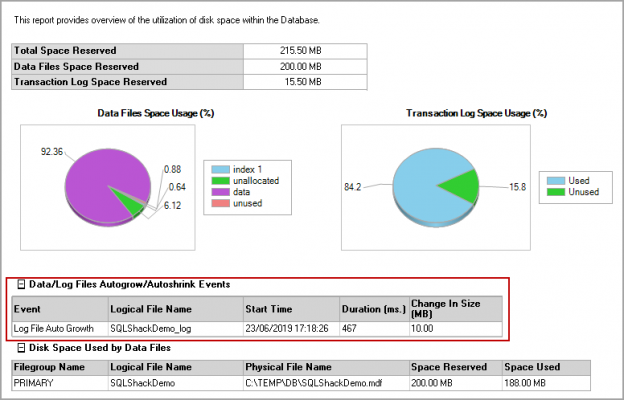
Monitoring the growth of the SQL Database is one of the essential tasks of the SQL Server DBA. In this article, I am going to explain how we can monitor the growth of the SQL database using the default trace. First, let me explain the default trace in SQL Server.
Read more »
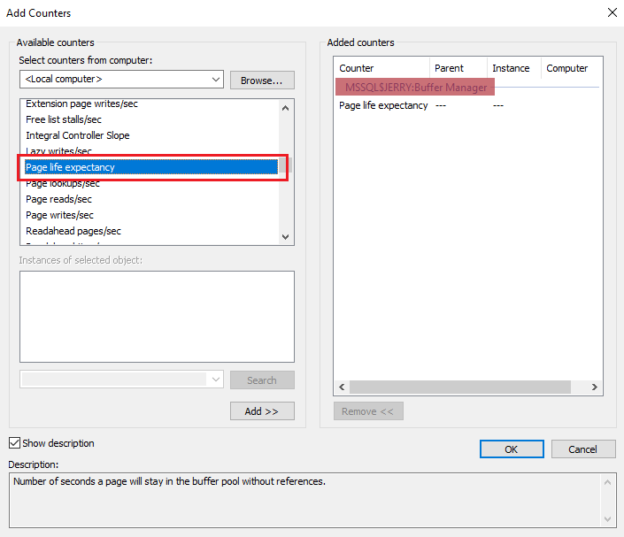
Page Life Expectancy (PLE) is an age of a data page in seconds in the buffer cache or buffer memory after querying the tables with the loading data page into the buffer memory. Page Life Expectancy value indicates the memory pressure in allocated memory to the SQL Server instance. In most of the cases, a page will be dropped from buffer periodically.
Read more »
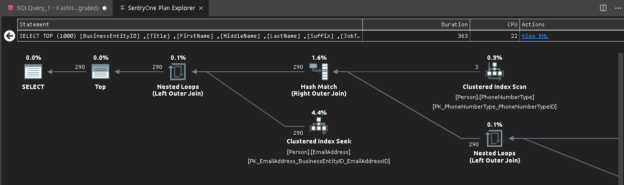
This article gives an overview of viewing execution plans in the Azure Data Studio.
Read more »
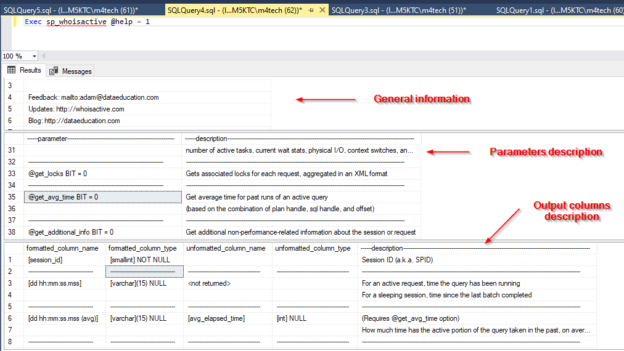
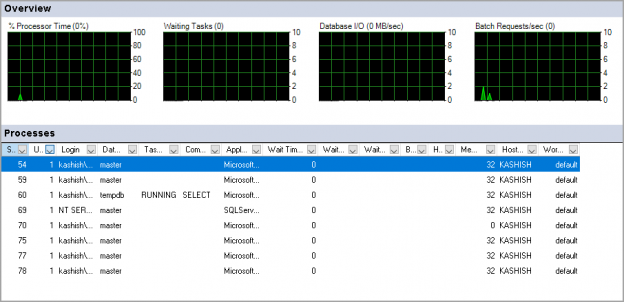
In this article, we will talk about sp_WhoIsActive stored procedure and how we can use it to monitor currently running activities in SQL Server.
Read more »
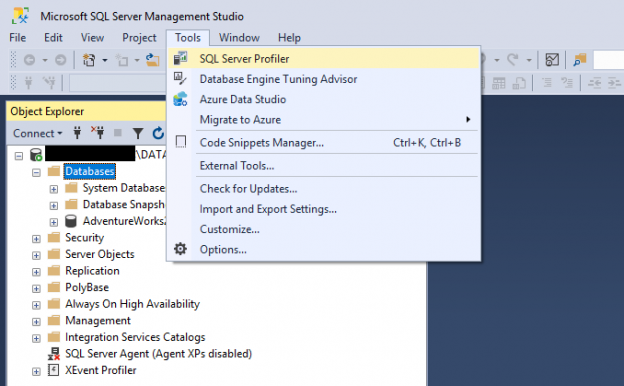
In this article, we will describe SQL Server Profiler and how it can be used. In addition, we will mention the tools that are integrated with it- plans about its deprecation, and what are the alternatives?
Read more »
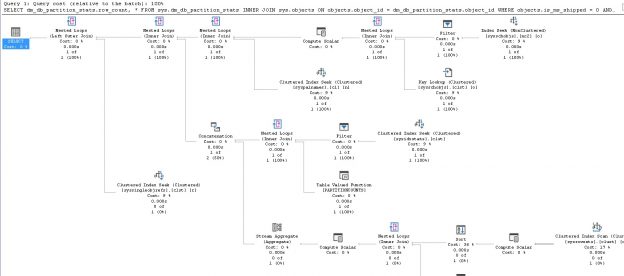
There is a multitude of database metrics that we can collect and use to help us understand database and server resource consumption, as well as overall usage.
This data can include hardware statistics, such as measures of CPU or memory consumed over time. We can also examine database metadata, including row counts, waits, and deadlocks.
Read more »
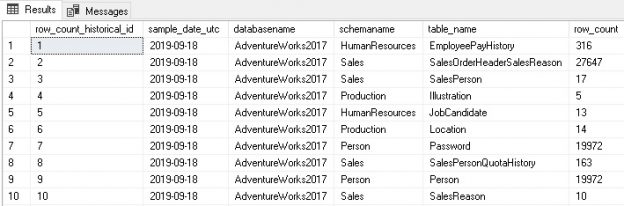
Database metrics can be collected, maintained, and used to help predict when processes go awry so problems can be resolved before they become severe. Understanding when an application or process misbehaves is not always easy. We are often left waiting until a server, application, or service breaks or enters an undesirable state before we know something is wrong. At that point, we are forced to rush and resolve a production problem quickly, before its impact becomes severe.
Read more »
This article gives an overview of the KILL SPID command and how to monitor the rollback progress.
Read more »
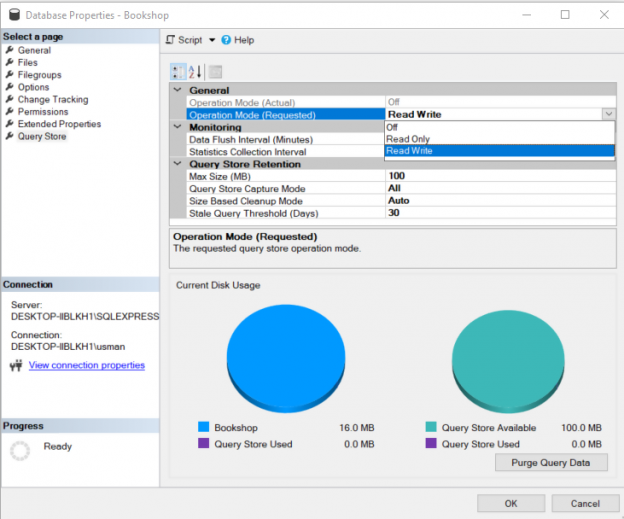
SQL Server Query Store is a performance monitoring tool that helps us evaluate the performance of a SQL query in terms of several different performance metrics such as CPU and Memory Consumption, execution time and the I/O cycles consumed by the query. Query store is similar to the windows “Task Manager”. A task manager provides information about the CPU, Memory, Network and Disc consumption of a process. Similarly, the Query Store provides insight to similar information.
Read more »
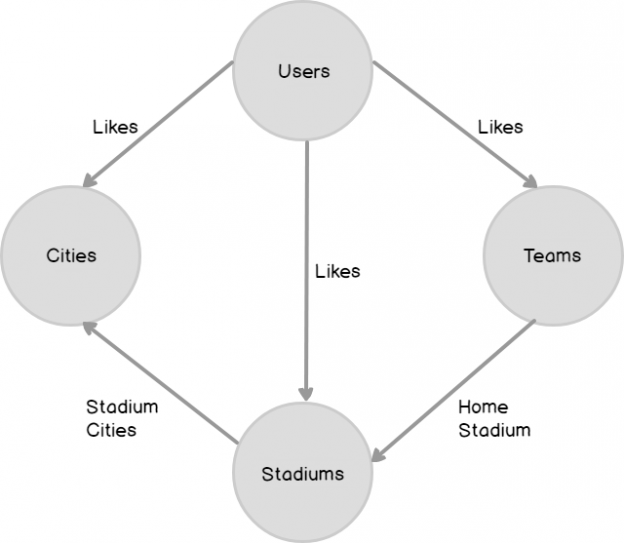
A graph database is a type of NoSQL database that is based on graph theory. Graph databases are ideal for storing data that has complex many to many relationships. In this article, we will study the very basics of graph databases with the help of a simple example.
Read more »
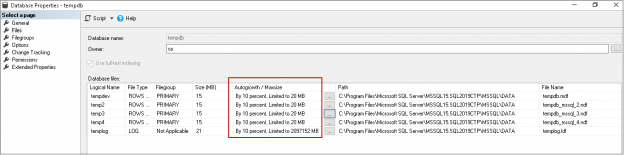
This article explores the usage of TempDB and different ways to shrink the TempDB database in SQL Server
Read more »
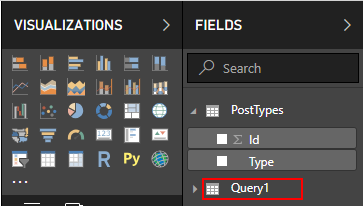
One shared characteristic among popular data visualization tools such as Power BI is the ease at which data can be extracted from a variety of disparate data sources, usually at a click of a button, as shown in Figure 1. Such convenience, though, tends to come at a cost as you often have little control over how background scripts used to extract data are generated. Yet, this should be of utmost concern for data architects and BI developers alike as rarely do you find auto-generated scripts that are efficient and optimal. In this article, join me as I put on my DBA hat and trace, monitor and review SQL batch statements that are auto-generated by the Get Data feature in Power BI using SQL Server Extended Events.
Read more »
It is essential for the DBA to need to ensure the SQL Server database performance. Performance tuning is an open-ended task, and you need to ensure the monitoring of various database parameters.
Read more »
This article is the sequel in a series about SQL Server monitoring tools and common performance issues. Before reading this piece, it advisable to read the previous two articles about monitoring tools for disk I/O and memory performance:
Read more »
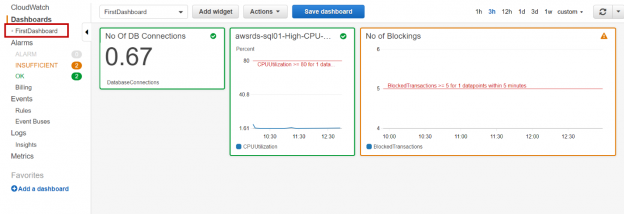
In this article, we will review how to monitor AWS RDS SQL Server database instances and setup email notifications using event subscriptions and CloudWatch alarms.
© Quest Software Inc. ALL RIGHTS RESERVED. | GDPR | Terms of Use | Privacy