This article explains what database monitoring is and why it is essential. Then, it illustrates the different methods for monitoring MongoDB NoSQL databases.
Read more »
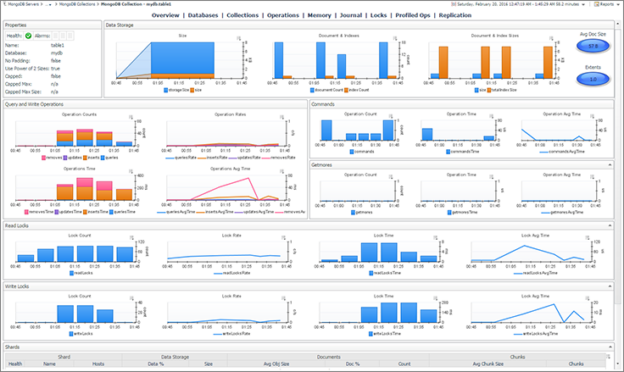
This article explains what database monitoring is and why it is essential. Then, it illustrates the different methods for monitoring MongoDB NoSQL databases.
Read more »
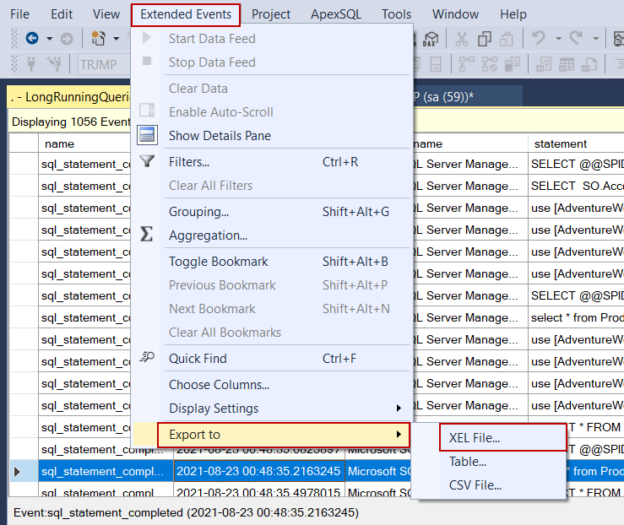
This article aims to provide some beneficial tips about SQL Server extended events that make it easier to create and use event sessions.
Read more »
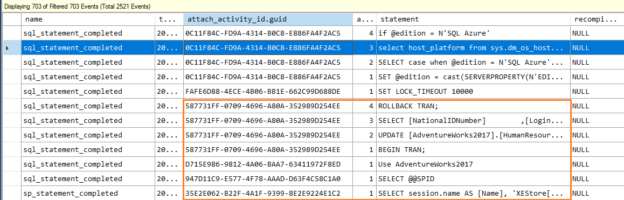
This article explores the Causality tracking option in the SQL Server Extended Events session(XEvents) and its usefulness in troubleshooting performance issues.
Read more »
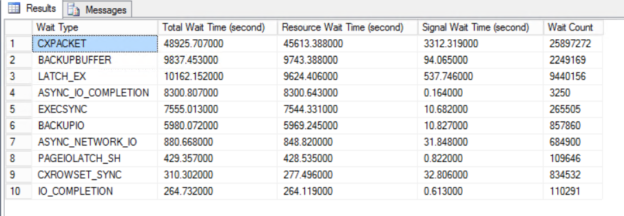
In this article, we will explore, how we can increase SQL Server performance with the help of the wait statistics. Wait statistics are one of the most important indicators to identify performance issues in SQL Server. When we want to troubleshoot any performance issue, at first we need to diagnose the problem correctly because correctly diagnosing problems help with half of the solution. Now, let’s learn wait statistics which helps to identify performance issues properly.
Read more »
In this article, we will learn some basic tips for SQL Server performance tuning. Tuning the SQL Server performance will help to access data faster so the applications data interaction performances will enhance.
Read more »
Performance Monitor is an oldie but goldie tool to analyze performance problems. In this article, we will learn how we can write Perfmon counter data to a SQL database through the ODBC connection.
Read more »

In this article, we will discuss how to resolve I/O problems that is a very important point for the SQL Server troubleshooting. The storage subsystem is one of the significant performance factors for the databases. Detecting and identifying I/O problems in SQL Server can be a tough task for the database administrators (DBAs). Generally, the underlying reasons for the I/O problems can be:
Read more »
This article will cover the usage details and performance advantages of the memory-optimized table variables.
Read more »
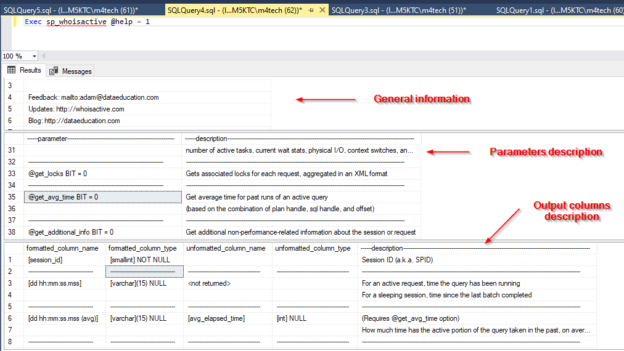
In this article, we will talk about sp_WhoIsActive stored procedure and how we can use it to monitor currently running activities in SQL Server.
Read more »
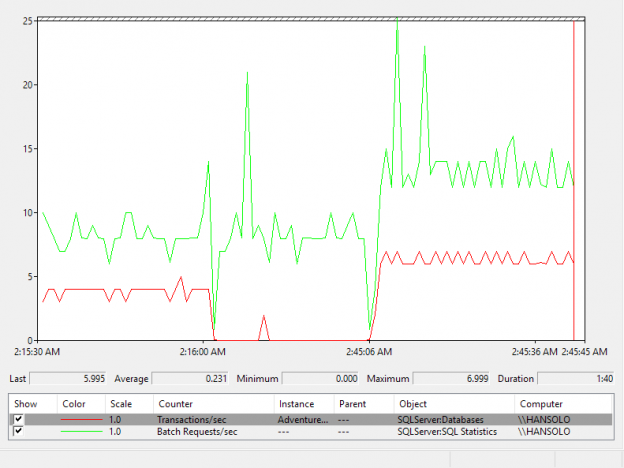
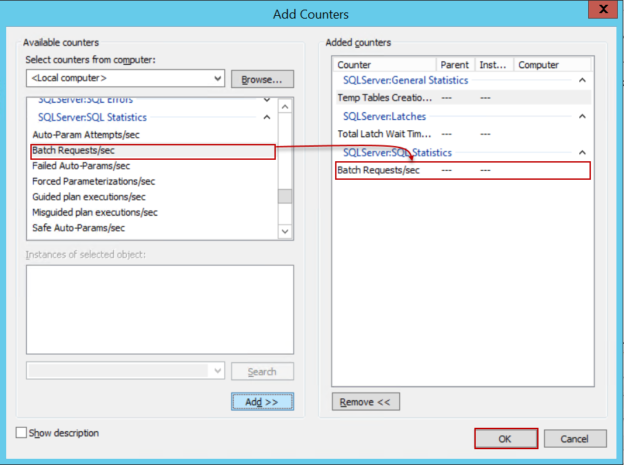
When maintaining SQL Server, it is essential to get an accurate perception of how busy it is. Two metrics that are often considered as indicators of how busy SQL Server is are Batch Requests/sec and Transaction/sec. When those metrics trend higher, they often affect all other metrics and make them go higher as well. While they could look similar, they are using a different type of starting point for measurement; the batches and transactions. So, to correctly understand those important metrics, lets first try to understand what the batches and transactions in SQL Server are and what are the differences between the two
Read more »
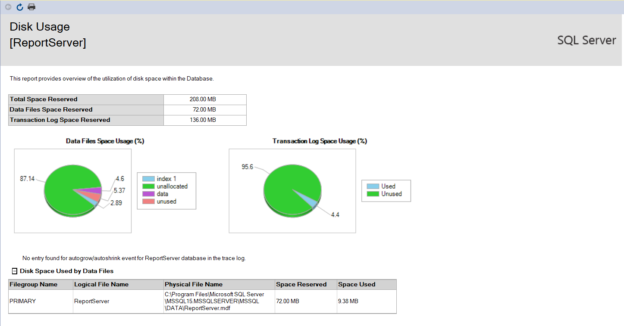
Measurements of the Reporting Services service (SSRS) monitoring cycle show which resources the reporting process consumes, and also, specific sets of counters show the particular type of the reporting process deployment in use, Native and SharePoint mode. The entire reports processing occurs in the Report Server, which is the core element of SSRS architecture, and among all features, collaboration with SharePoint platform is the most crucial, because of advantages of report processing and generating reports for SharePoint components.
Read more »
SSIS Pipeline performance counters monitor the processes which are related to the execution of packages and the Data flow engine’s the most crucial feature, the (Data) Pipeline. Their measurements reveal in which way the memory resources are acquired during the execution of the SSIS packages, and also, show the amount of memory used during that events. The proficient monitoring of the SSIS Pipeline memory usage can mitigate the potential issues of memory and data leakage, data transformation interruptions and overall, avoid data integration damage.
Read more »
Although there is no real standardized classification of SQL Server Integration Services performance counters, the two main types are:
Read more »
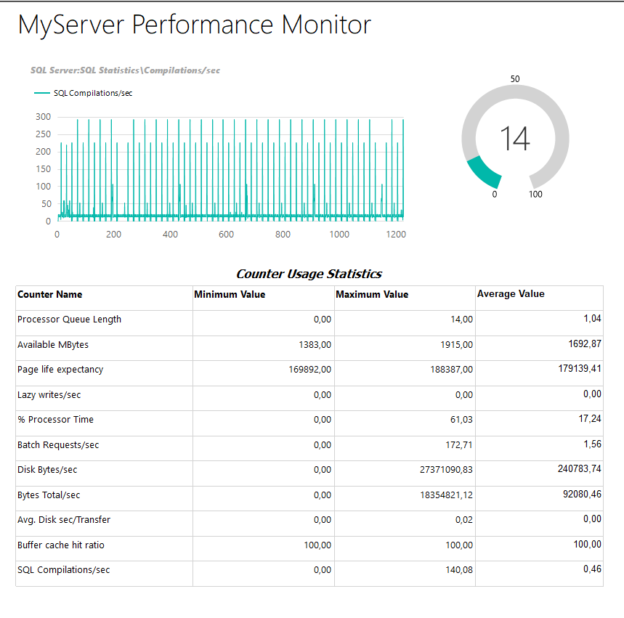
Checking the many SQL Servers health conditions is one of the DBA basic tasks. Monitoring many servers and databases, day after day can be a very tedious job. There are many aspects to look for when checking the server performance figures. Such aspects include among others: CPU, Read and Write Disk counters, Various memory counters and locks performance counters. The DBA needs a tool that checks the most important counters and output a report that states whether the server is considered to be healthy or not. For every aspect, a counter is chosen to represent it to be included in the overall report.
Read more »
In the previous part of this series, we presented the processor metrics that indicate hardware component problems that can affect SQL Server performance
In this part, we will present processor metrics that are not necessary in every performance monitoring scenario, but are useful for deeper investigation and troubleshooting Read more »
In SQL server processor performance metrics – Part 1 – The most important cpu metrics, we described the Processor Queue Length and two most important processor time counters – Processor % Processor Time and Process % Processor time
In this part, we will continue describing important time processor counters Read more »
In this part, we will continue with SQL Server memory performance metrics and present Lazy Writes, Free List Stalls/sec, and Memory Grants Pending Read more »
© 2025 Quest Software Inc. ALL RIGHTS RESERVED. | GDPR | Terms of Use | Privacy