In this article, we will study how to recognize and resolve the SQL blocking chain by determining and troubleshooting the root cause.
Every SQL Server database connection is represented by a unique Session ID (SPID) and is authenticated and authorized with a SQL login and appropriate access role. A SQL Server session is often called a process, each client connection to the SQL Server uses system database structure and consume the system resources that can be identified with the help of system DMV.
A client application refers to a CMD, backend application, application services, SQL Server Management Studio, or any other tool which allows access to the database and manipulation of the data. A single client application can have multiple connections, and there is no distinction between multiple connections from a single client application or multiple connections from more than one client application. SQL Server will execute client requests and complete each client connection, but unfortunately, that connection can block each other, whether that can be from the same source or different application source.
RDBMS database engine uses transaction lock-based connection concurrency as part of ACID. The database engine treats a number of concurrent requests; therefore, there can be a certain scenario with transaction locking collaboration. It happens when one of the transaction holds a lock on a particular resource of the database and another Transaction endeavors to obtain that lock which is conflicting on the same resource. As simple, blocking happens when one transaction puts a lock on resources then releases it so another transaction can use those resources. Blocking actually prevents conflicts from occurring. It occurs in little time allotments, and it is excessively snappy.
Unfortunately, blocking can cause poor performance when the duration of locks is too long on the resource. If a resource lock lasts too long, then next SPID must wait in the transaction blocking chain. The total elapsed time taken by the SQL Server connection and number of query execution inside the transaction decides how long the lock would be placed on the object. In that sequence way, it affects other queries too. The execution time of the query is much dependent on Query Type, several SQL statements inside the single request, ISOLATION LEVEL, MAXDOP, Lock within the statement, and many more.
For the queries being executed within a transaction, the lock duration is ruled by the query statement execution and TRANSACTION ISOLATION LEVEL used within the query. Damage to SQL Server performance is largely due to one of the following reasons:
-
The procedure or SQL query has finished the execution; however, the transaction is not committed by the application due to some reason at the application level
Ideally, an application request for a query would execute rapidly, and either get it committed or rolled back by the application. However, if there is something wrong with the application, the SQL Server Database Engine will stand by and wait for an application response. This blocks all subsequent transactions
-
At the point where the query execution took more time than expected, the resource lock won’t be released. This could be due to issues like memory, CPU, index, poor query logic, etc.
Since a poorly-written statement can take more time than expected, insert, update, and delete statements should be written in a straightforward manner. During the execution, Query will hold the lock on the resources(pages) of the article(Tables), which are being utilized in Query, it tends to be row lock, page lock, table lock. Therefore, next blocked sessions need to hold up until the completion of the main transaction
-
Multiple queries executed in a single transaction could take longer execution across the databases or SQL Server instances (Using Linked Server)
A remote database query or remote method can be executed inside the SQL Server. If the remote server is in the same region, there should be fewer latency issues; however, with greater distances, latency can degrade your query performance
Several SQL Query within the transaction can be executed across the database and SQL Server instance from the application end too. Any query of the bunch took more time than expected then lock holds on the table will continue, which are placed from the previous query within the transaction until transaction commit or rollback
In the SQL blocking chain, it can be difficult to recognize which query is causing trouble since there can be different SQL Statements and procedures in a single transaction. Using the T-SQL script, we can identify the SPID at the top of the SQL blocking chain with the SQL statement from the SQL Server Management Studio.
Query to List Blocked Requests or Sessions in SQL Blocking Chain
SQL Server Dynamic Management Views (DMV) return internal engine state information. We can utilize certain DMVs and manipulate some metrics to identify a SQL blocking chain.
The sys.dm_exec_requests table returns current executing requests with certain fundamental information, for example, Database name, ISOLATION LEVEL, request start time, CPU utilized time, elapsed time, wait type, Execution Plan(plan_handle), command, blocking_session_id, and more. To screen the blocking on the SQL Server, we can use the command shown below to see various threads which are blocked by other transaction or request.
For instance, an update statement has been executed with BEGIN TRANSACTION and before committing it, we have two SELECT and UPDATE statements. The below query can assist us with troubleshooting the issue:
|
1 2 3 4 5 6 7 8 9 10 11 12 13 |
SELECT session_id, blocking_session_id, start_time, status, command, DB_NAME(database_id) as [database], wait_type, wait_resource, wait_time, open_transaction_count, plan_handle FROM SYS.DM_EXEC_REQUESTS WHERE session_id > 49 |

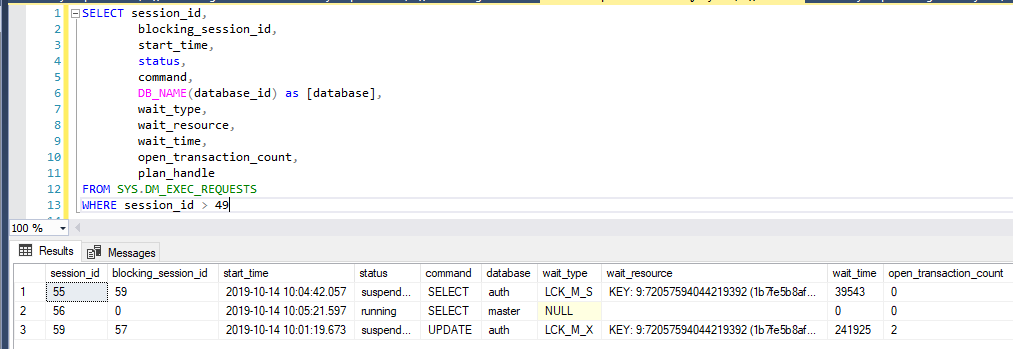
The above command will return the fundamental details of the blocked request. However, we must look closely to see the parent blocking requests. Here, Session id (55) is getting blocked by SPID 59, and 59 is getting blocked by 57, yet 57 isn’t shown in the DMV(SYS.DM_EXEC_REQUESTS) result. Since execution is finished, yet not committed or rolled back. All SPID or threads in SQL blocking chain will be with the suspended wait type, excluding most parent SPID.
Identify and resolve the SQL Blocking Chain using Recursive Metrics on DMV
With careful examination of the above DMV, we can determine the blocking problems that have occurred. How can we use this information to resolve common blocking scenarios, such as which blocking session is causing problems for others and why?
Recursive CTE allows us to locate the most damaging parent blocking session or transaction, so we don’t have to analyze the complete blocking session chain when we are troubleshooting the SQL blocking issues:
|
1 2 3 4 5 6 7 8 9 10 11 12 13 14 15 16 17 18 19 20 21 |
;WITH CTE AS ( SELECT session_id, blocking_session_id FROM SYS.DM_EXEC_REQUESTS WHERE session_id > 49 and blocking_session_id <> 0 UNION ALL SELECT X.blocking_session_id AS session_id, ISNULL(Y.blocking_session_id, 0) AS blocking_session_id FROM CTE X OUTER APPLY [fn_get_blocking_session](X.blocking_session_id) Y WHERE X.blocking_session_id <> 0 ) SELECT DISTINCT sdes.session_id, host_name, program_name, sqltext.TEXT, dmv.wait_type, dmv.wait_resource FROM CTE c INNER JOIN SYS.dm_exec_sessions sdes ON c.session_id = sdes.session_id LEFT JOIN sys.dm_exec_requests dmv ON c.session_id = dmv.session_id OUTER APPLY sys.dm_exec_sql_text(dmv.sql_handle) AS sqltext WHERE c.blocking_session_id = 0 |

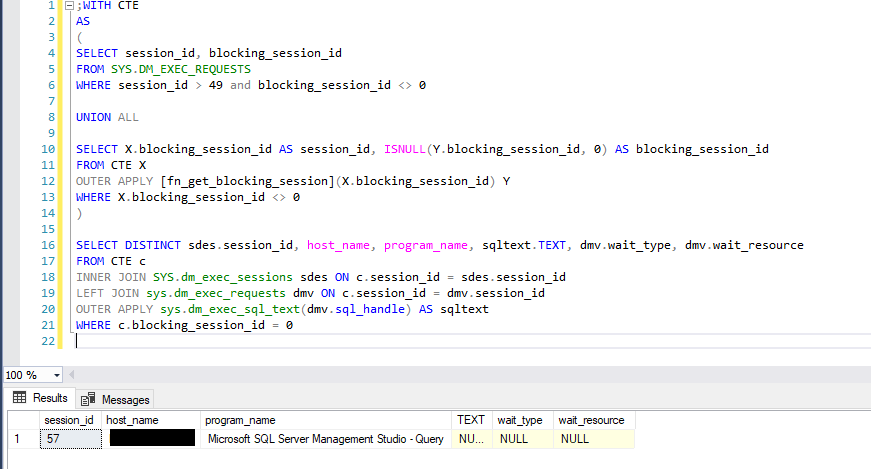
If the execution of the session is finished, but not yet committed or rolled back, the above recursive query will assist us with getting that session request subtleties from SYS.dm_exec_sessions, which won’t exist in sys.dm_exec_requests table. In the above result set, execution of SESSION ID: 57 has finished, so we cannot have the query explanation of that session. Yet, DBCC INPUTBUFFER(session_id) gets more event data of current execution for the specific session id:
|
1 |
DBCC INPUTBUFFER (57) |
–57 is a parent Blocking Session ID in SQL Blocking chain.

wait_resource and wait_type are also significant in SQL Server blocking. If a remote procedure call is executing inside the primary parent blocker session, then wait_resource will help us to troubleshoot it with the remote server name and session id (at the remote server). So, we can distinguish and investigate the issue at the remote server end.
In an eventful database, countless user transactions compete for instantaneous access to the same tables and indexes. As seen, usually SQL Server arbitrates access to these shared resources by using various types of locks. Blocking occurs when more than one session requests a lock on a resource, such as a row, page, or table, but SQL Server is not able to grant that lock due to another session already holding a non-compatible lock on that resource.
- Page Life Expectancy (PLE) in SQL Server - July 17, 2020
- How to automate Table Partitioning in SQL Server - July 7, 2020
- Configuring SQL Server Always On Availability Groups on AWS EC2 - July 6, 2020

