Introduction
As DBAs, we all get to the point where we are asked to setup a new server for a specific environment. Setting up a new server is not a big thing but giving the answer to the question that “how well it will work” might be tricky.
There are tons of items which we can setup to measure how well the newly installed server will response but here I will discuss one of the most important resource of the server “Disk”. Most often the disk is not measured correctly or I have seen environments where the disk response time has never been measured. I will discuss here a tool from Microsoft which is very handy and can solve your problem very quickly. The diskspd.exe!
It’s the superseding version of SQLIO which was previously used to measure IO response time for disk. The source code of diskspd.exe is hosted on GitHub. You can download this free utility from Microsoft’s website using this link.
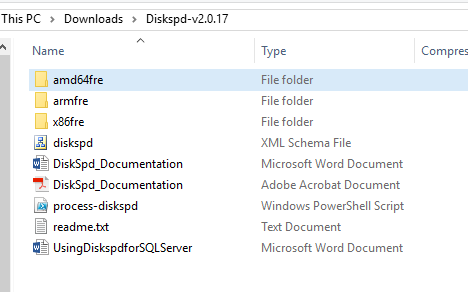
After you will download the utility you will get a zip file. Just unzip the file and it will give you the folders and files as shown in the below screenshot. You will be needing the exe of diskspd inside the folder “amd64fre” if you have a SQL Server 64-bit version (most of us will be having this).

Let’s get started
Now we can start the actual tests using the utility. To simplify things for the test we can copy appropriate executable file to a folder in C Drive like “C:\diskspd_test” and create a folder in the drive which you want to test like for this instance H Drive and I created a folder TestLoad in H Drive.
The utility is capable enough to create a good load file for you and test it for read and write. Though there are many ways to customize your testing but I will suggest you to start with a simple yet with solid results.
Mentioned below is the test arguments I used. I will explain each argument I used.
Sample Command Line Argument:
diskspd -b64k –d120 –o32 –t4 –h –r –w25 –L –c2G D:\TestLoad\TestLoad.dat > diskspd_resultdetails.txt
- -b64k: This indicates that a 64KB block size will be used for the load. This is good because ideally speaking your drives should be formatted by 64K block size. Though you can increase or decrease it based on your custom built environment.
- -d120: This means that the duration of the test will be 120 seconds. You can span it to more time if you want to test the disk with larger and longer loads. Which is a good idea.
- -o32: This is the number of outstanding I/O operations which is like your queue length.
- -t4: This means that each file will have 4 threads attached to it. I have 4 core processor so I added 4 and you can customize it to match your server specifications.
- -h: This will disable the software and hardware buffering to mimic SQL Server.
- -r: The utility can perform sequential reads (default) or random read. I would prefer to use random reads. The r argument is to specifically ask utility to do only random reads.
- -w25: The utility can do reads and writes test and by default it only does the read. But we want read and writes both. It’s a good idea to split a SQL Server load to 25% Writing and 75% reading. Though you can test your disk as per your requirements like for log files you should only specify –w100 to only test writing.
-
-L: This will write the Latency of the disk being tested to the result file. Surely, we all need that!
- -c2G: This will create a test load file of 2 GB on the specified location.
- > “diskspd_resultdetails.txt”: This is the filename of the results. The file will be created in the C Drive where you will place the diskspd.exe file, in this case, “C:\diskspd_test”.
Well the test will run for 2 minutes in this case and it will do the specified work you mentioned in the arguments. After the test has been run completely it will generate the results file and then you will read and analyze the file.
Let’s go ahead and read what my results are
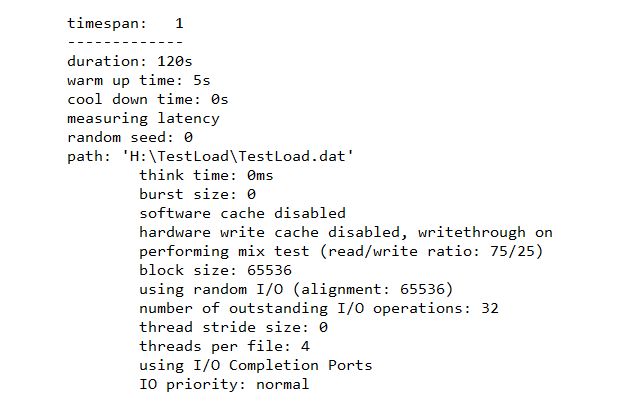
The first part of the results which is shown below tells us what arguments and settings the utility will use to test the load. So, all the arguments explained earlier are mentioned in further details by the utility itself.

The CPU
The second part of the results shows how the CPU behaved while the load was executed. All the results will have two parts, first will be detailed for each resource and the last will be average or total. So we can quickly go to the last part just to see how was the average CPU while the load was executed to see if we have CPU bottleneck or its perfectly suits our load.

The Disk
The third part is the core of all the utility, the disk! This again has different parts in the results.
First part shows the Total IO as a Summary to see how well the disk responded. You can see the “AvgLat” column to see the Average Latency of the disk for total IO. Not to go into the details of the latency but generally speaking it should remain under 20ms. If it goes beyond then you have serious issues with your server. (I know my system sucks but the drive is an OLD SATA III).
The I/Os can on the lower side as the load is divided on worker threads so you can directly go to the TOTAL column highlighted in the below screenshot which will show you the total load (in 64k block size in our case).
The Second part shows Reads and third part shows Writes. This is most important part of the results. You can go into the details of every column but the Latency should be kept in mind as this is the main reason for slowness when the actual load will be executed by the users. This clearly shows how well your disk is performing under your load for reads and writes.
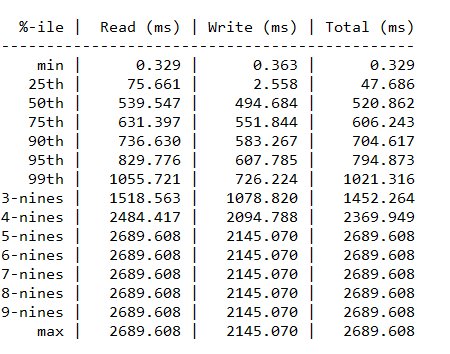
The last part of the results is dedicated to the latency and shows how well the disk performed while the load was executed. This numbers are in milliseconds and you can focus on minimum and maximum. So keep in mind that the best case scenario will be minimum and the worst case scenario will be max and that will be the time when your server will be in peak hours.

Now, after having the knowledge of this awesome utility, you can design multiple test load for different environment and run them so see how storage system and CPU is performing. The detailed tests can give your insight and you can modify the load of upgrade your resources accordingly to your needs.
- How to identify slow running queries in SQL Server - May 31, 2017
- Adaptive Query Processing in SQL Server 2017 - April 28, 2017
- What is the SQL Server Virtual Log file and how to monitor it - April 26, 2017

