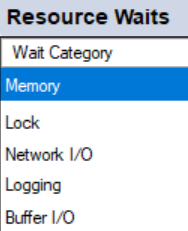
When dealing with SQL Server performance tuning waits, we may see RESOURCE_SEMAPHORE waits along with other related monitoring that indicates memory as a possible pain point for our server (such as the below image that shows memory being one of the top waits overall).

Memory showing as the top wait
We should expect to see some waits like SOS_SCHEDULER_YIELD or CX_PACKET, but this wait in high numbers indicates that we want to investigate SQL Server and memory, assuming our server architecture is designed to handle the functionality.
For example, if we’re using a 4GB memory laptop to run an application server, SQL Server, and ETL processes along with other memory-intensive applications, our design doesn’t match our function. We won’t investigate designs like this and will assume our design matches our function.
Uncovering RESOURCE_SEMAPHORE waits
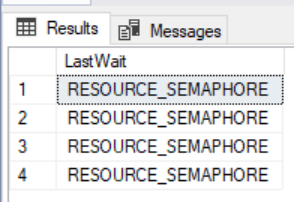
In the below query, before we do any SQL Server performance tuning, we look at the running queries to find four that return RESOURCE_SEMAPHORE waits (the query text is intentionally commented out):
|
1 2 3 4 5 |
SELECT t1.[last_wait_type] LastWait --, t2.[text] QueryText FROM sys.dm_exec_requests t1 CROSS APPLY sys.dm_exec_sql_text(t.sql_handle) t2 |

RESOURCE_SEMAPHORE waits appear as frequent waits when looking at running queries
We would only run queries like this if we don’t have any regular monitoring in place – otherwise, we would look at our regular monitoring for the current waits or last waits along with a quick overview of the type of waits (seen in the first image). This helps us confirm what we’ll need to investigate.
Troubleshooting query waits
Following the 80-20 principle with SQL Server performance tuning, we want to get fast wins as quickly as possible. In cases where our memory settings match our function, we may have the resources to extend memory on the server and solve this issue while reviewing costly queries or other performance optimizations. If we can’t wait on a solution and we have the capability of doing this, we should do it.
Memory settings
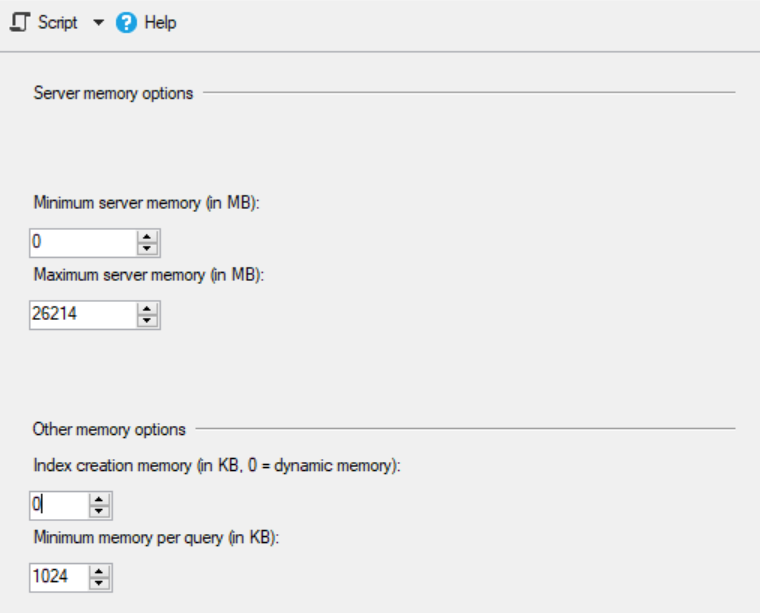
In the below image, we see that our test server, in this case, is set to use 80% of the available server’s memory and that we use the default setting for minimum memory per query used. In some cases, we may want to use up to 90% of the server’s memory if we have nothing else running on the server, or we may want to use much less if our server has other applications that are memory intensive.

Using the SQL Server Management Studio, select Properties then Memory
Indexing and appropriate indexing on frequent queries with RESOURCE_SEMAPHORE waits
In addition to the above query that returns the last wait along with the query text, we can also review which queries are requesting memory for better SQL Server performance tuning.
In the below query, I look at queries by their memory requests, status, along with the seconds before these terminate. According to Microsoft, the column requested_memory_kb is measured in kilobytes, so I convert it to megabytes for organizing the most expensive along with determining the ratio of requests to allotted memory.
In addition, the grant_time tells us when the query was granted memory, but if it’s NULL, Microsoft points out this means the query is waiting on being granted memory. Although I have the query text commented out, I would review these queries if I see unusual activity based on the amount of memory requested:
|
1 2 3 4 5 6 7 |
SELECT ((t1.requested_memory_kb)/1024.00) MemoryRequestedMB , CASE WHEN t1.grant_time IS NULL THEN 'Waiting' ELSE 'Granted' END AS RequestStatus , t1.timeout_sec SecondsToTerminate --, t2.[text] QueryText FROM sys.dm_exec_query_memory_grants t1 CROSS APPLY sys.dm_exec_sql_text(t1.sql_handle) t2 |

I would research queries where you see unusually large memory requests for SQL Server performance tuning with this wait
For troubleshooting, I want to look at the queries that are requesting large memory grants and review their execution plans for costly sort, hash, or table scans. We may find tables without indexes or tables with inappropriate indexes for queries. In most cases, I’ve found SQL Server performance tuning for this wait with indexing – new indexes or additional indexes. In rarer situations, I’ve found the statistics are completely out of date.
Clustered columnstore indexes
If we see frequent queries that are performing large aggregates on tables (80-100% of the entire table) with scheduled loads, we may want to review our indexing, if we’re not using clustered columnstore indexes on these tables. While loading tables with clustered columnstore indexes can add memory overhead (thus, we can drop before a load and add these after a load), these will reduce our memory footprint in queries that perform large aggregates on tables.
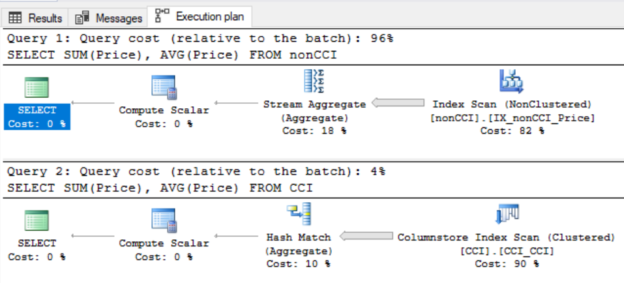
Notice the impact of the SQL Server performance tuning involving index types in the below example where I run an aggregate query against two identical tables of data with one having a non-clustered index on price (nonCCI table) and the other having a clustered columnstore index on the entire table (CCI table). The clustered columnstore index table sees better statistically significant results in performance:
|
1 2 3 4 5 6 7 8 9 |
SET STATISTICS IO ON SELECT SUM(Price), AVG(Price) FROM nonCCI SELECT SUM(Price), AVG(Price) FROM CCI SET STATISTICS IO OFF |

Clustered columnstore indexes are a top optimization technique for large aggregate queries with scheduled loads
Table ‘nonCCI’. Scan count 1, logical reads 1120, physical reads 0, read-ahead reads 0, lob logical reads 0, lob physical reads 0, lob read-ahead reads 0.
Table ‘CCI’. Scan count 1, logical reads 0, physical reads 0, read-ahead reads 0, lob logical reads 4, lob physical reads 0, lob read-ahead reads 0.
Table ‘CCI’. Segment reads 1, segment skipped 0.
Aggregate queries are seldom the problem here with this wait, but reducing an aggregate query’s memory impact when they do run will help us with other queries by freeing up resources. If we can reduce resource use in general, we should take every opportunity to do so. For SQL Server performance tuning, we’ll generally want these clustered columnstore indexes in OLAP designs or environments, whereas we’ll want to avoid them in tables with high data write and read volume throughout the day.
Other waits that may compound problems
In some cases, we may experience a compounded problem with this wait affecting our queries because of other waits that are also causing delays. In addition to memory pressure, we may be waiting on a response from another server (ASYNC_NETWORK_IO) or on a log bottleneck (WRITE_LOG). If we identify these other weaknesses, we’ll also want to improve the performance of these other servers, disks, or bottlenecks.
Hybrid environments
In most environments today, we run both OLAP and OLTP designs. These hybrid environments will continue to become more frequent, and we must remember that the type of querying will differ. The best design for SQL Server performance tuning is to keep OLAP and OLTP environments demarcated on different servers if we have the resources to do so. This will help us optimize for each environment.
Summary
Let’s consider that we’ve looked at the SQL Server performance tuning of the RESOURCE_SEMAPHORE waits on a server where we shouldn’t see this wait. If we are running SQL Server from a limited machine with a web application on top of it along with other memory-intensive applications, it would be unusual not to see this wait. Likewise, if we have a server with very little memory relative to our data and query load, it would also be unusual to not see this wait. Adding more resources may not be the preferred solution, but it may be the most appropriate solution. Also, we may use this as a chance to improve our queries through improved indexing and type of indexing.
See more
Check out SpotLight, a free, cloud based SQL Server monitoring tool to easily detect, monitor, and solve SQL Server performance problems on any device

- Data Masking or Altering Behavioral Information - June 26, 2020
- Security Testing with extreme data volume ranges - June 19, 2020
- SQL Server performance tuning – RESOURCE_SEMAPHORE waits - June 16, 2020


