This article intends is to give helpful SQL Server performance tuning advice to those who want to learn performance tuning.
Introduction
One day a rooky database administrator has said to me: Understanding and solving SQL performance issues require an enormous amount of work.
Me: There is no doubt, SQL Server performance tuning issues are very complicated problems and required extra labor to resolve them but the key point is to determine the performance problem properly. How do you monitor and detect your database system?
Junior DBA: We are using SQL Server’s Activity Monitor
Me: It is not a good choice to monitor the SQL Server activities because it does not show all issues clearly and renames and groups some of the wait statistics. I think you have to learn to use sp_WhoisActive.
In this little conversation, we can realize that dealing with performance tuning seems a very struggle task for the junior database administrators or newbies but if we know how to diagnose the problem, we can try to find out a proper solution for the problem. In general, the following reasons can affect SQL Server performance negatively:
- Improper SQL Server instance or database settings
- Insufficient hardware resources or incorrect settings
- I/O problems
- Incorrect TempDb settings
- Lock or deadlock problems
- Poor performer queries
In order to resolve these types of performance problems, we need to monitor SQL Server activities, and if we don’t have enough budget for the advanced 3rd party SQL Server performance monitoring tools, we can take advantage of the sp_WhoIsActive stored procedure.
Why do we need to monitor SQL Server?
Monitoring the database activities is an integral part of the SQL Server performance tuning to understand and identify the performance problems more properly. Monitoring the SQL Server metrics on a regular basis will always help to obtain a reasonable clue to diagnose the problem.
In this context, we have numerous tool choices but if we want to use a free tool sp_WhoIsActive can be the best choice to monitor the SQL Server activities. For this reason, learning the sp_WhoisActive usage and interpret the results of it always helps to identify and troubleshoot performance problems. At the same time, sp_WhoIsActive helps to collect the activities of the SQL Server stores them into a table through a scheduled job. So that we can obtain a little warehouse that helps to analyze a specific time period or historical activities of the SQL Server.
Monitoring SQL Server activities through sp_WhoisActive
As we stated before, sp_WhoisActive is a comprehensive and helpful monitoring tool. WhoisActive is similar to a Swiss army knife because it allows us to customize it with various parameters so that we obtain different information according to our requirements. The following are the most useful parameters and can help to resolve the performance and lock issues.
@get_plans = 1: enables to show execution plans for the running queries
@get_locks = 1: enables to show a detailed XML snippet which includes all details about the locked objects
@get_additional_info = 1: enables to show a detailed XML snippet that includes details about the running process.
We can execute the WhoIsActive quickly to show the current activities of the SQL Server as follows.
|
1 2 3 4 |
EXEC sp_WhoIsActive @get_additional_info=1, @get_plans=1, @get_locks=1; |
At the same time, WhoisActive allows us to insert its result set into a table. To enable this feature of the WhoisActive, we will execute the following script and it will create a table that is needed to store the data.
|
1 2 3 4 5 6 7 8 9 10 11 12 13 14 15 16 17 18 |
DECLARE @Table_CreatScript VARCHAR(MAX); DECLARE @DatabaseName VARCHAR(100)='AdventureWorks2017'; --Enter the database name DECLARE @SchemaName VARCHAR(100)='dbo'; --Enter the schema name DECLARE @TableName VARCHAR(100)='WhoisActiveLogs'; --Enter the table name EXEC sp_WhoIsActive @Schema=@Table_CreatScript OUTPUT, @return_schema=1, @get_additional_info=1, @get_plans=1, @get_locks=1 SET @Table_CreatScript=REPLACE(@Table_CreatScript, '<table_name>', CONCAT(@DatabaseName, '.', @SchemaName, '.', @TableName)); EXEC(@Table_CreatScript); |
Collect SQL Server activities with SQL Server Agent Job
After the table creation, we need a job to collect data automatically and on a scheduled basis. At first, we open up a new SQL Server Agent Job and give a name to it.

We click the Steps menu and click the New button to add a new step. On this new step screen, we give paste the following query into the Command box.

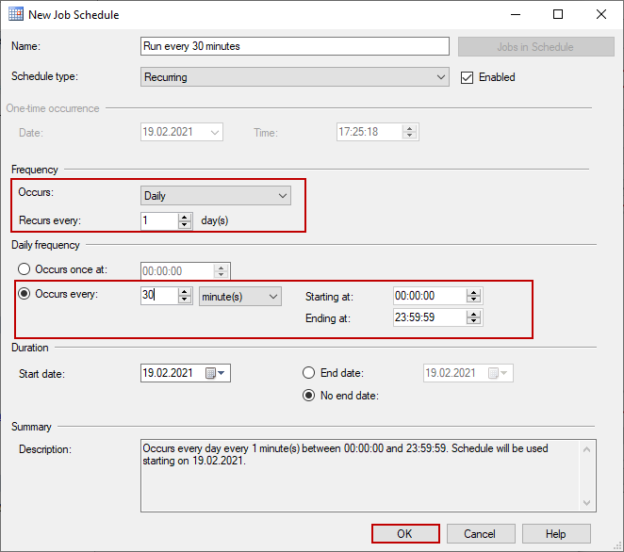
As the last step, we navigate the Schedules menu and schedule the job to run every 30 minutes.

After the creation of the job, it will start automatically and begin to collect the SQL Server activities. Now it’s time to analyze the data which is collected by the job so that we can resolve the SQL Server performance tuning issues.
Analyze
After collecting database activities, we can analyze a particular time period that the queries were running slowly or we can find out which queries CPU, read or write utilizations are very highest. Through the following query, we can detect which queries have used the most CPU in the last two days.
|
1 2 3 4 5 6 7 8 9 10 11 12 13 14 15 16 17 18 19 |
SELECT TOP 10 CPU, reads, writes, collection_time, start_time, [dd hh:mm:ss.mss] AS 'run duration', program_name, database_name, session_id, blocking_session_id, wait_info, sql_text, locks, query_plan, additional_info FROM WhoisActiveLogs WHERE collection_time BETWEEN DATEADD(DAY, -2, GETDATE()) AND GETDATE() ORDER BY CPU DESC; |
The locks column gives us all the locked object details.
The additional_info column gives us connection and session settings details.
Conclusion
In this article, we have learned a very helpful tip about SQL Server performance tuning. Monitoring the SQL Server activities is very important to overcome the performance issues and we can customize the sp_WhoisActive to collect the SQL Server activities so that we can analyze the collected information later.
- SQL Performance Tuning tips for newbies - April 15, 2024
- SQL Unit Testing reference guide for beginners - August 11, 2023
- SQL Cheat Sheet for Newbies - February 21, 2023


