In this article, we will continue to learn essential techniques of the SQL Server query tuning with practical examples.
Note: To learn more about SQL Query Optimization, please read SQL Query Optimization — How to Determine When and If It’s Needed article.
Query tuning is a bit complicated issue and if any database programmer wants to be successful on this topic, they can start with learning these basic methods to improve their skill. These methods can be quickly applicable to problematic queries as a solution and can be obtained dramatic performance improvements. The following items are the most known practical methods to improve the performance of the queries.
- Avoid using the asterisk “*” sign in SELECT statements
- Don’t use functions in the WHERE clause
- Use the covering indexes
- Use the UNION ALL operator instead of the UNION operator
- Use Actual Execution Plans instead of Estimated Execution Plans
- You can find all these tips in detail in Getting started with SQL Server Query Tuning article.
Now we’re going to add three more items to the list and talk about it, and we’re also going to reinforce our learning with practical examples.
- The disk activities of the query must be measured and analyzed
- Avoid using non-sargable queries
- Think twice before creating missing index suggestions of the execution plans
The main approach of query tuning must be to reduce the consumption of database resources. So that the execution time of the query will decrease or at least tuned query will consume minimum database resources.
One of the vital SQL Server resources can be counted as disk systems so it would be useful to obtain and analyze statistics about a performed query’s disk usage. In the next section, we will learn how to get statistics about a query’s disk activity.
Measure and analyze the disk activity
If we want to succeed in SQL Server query tuning, we should have sufficient knowledge about some tools. STATISTICS IO report is one of the major tools, that helps to find out the disk activity statistics of the executed queries. When we enable this option, it displays the statistical disk activity report of a query. It has very simple syntax only, we need to enable it before executing the query.
Syntax:
|
1 |
SET STATISTICS IO { ON | OFF } |
In the following query, we will enable the IO statistics and then execute the query. When we open the Messages tab, we can see the report output
|
1 2 3 |
SET STATISTICS IO ON GO SELECT * FROM Sales.vSalesPersonSalesByFiscalYears |
In this output, our eyes must first search the following measurement result because our goal should be to minimize these values.
- Logical reads value indicates the number of pages reads from the cache
- Physical reads value indicates the number of pages reads from the disk
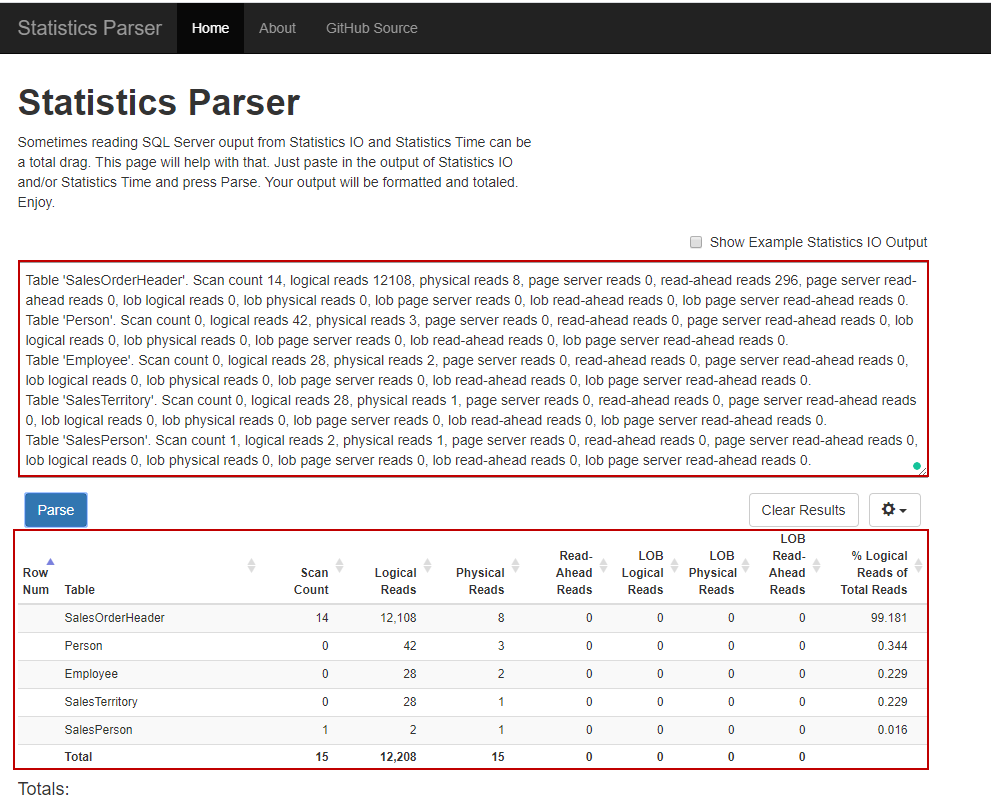
However, this report output may seem a bit sophisticated and difficult to read. For this reason, we can use the Statistics Parser to transform this output more readable. On this web page, we just need to only paste the output of the report and click the Parse button.
As we can see, we have obtained a well-formatted table report instead of the plain text report.
- Tip: The STATISTICS IO report might not be generated for the memory-optimized tables. In the following example, we will create a very simple memory-optimized table
|
1 2 3 4 5 6 7 8 9 10 |
CREATE TABLE dbo.SampleTable1 ( Column1 INT IDENTITY(1,1) PRIMARY KEY NONCLUSTERED, Column2 VARCHAR(100), Column3 VARCHAR(100), ) WITH (MEMORY_OPTIMIZED=ON ,DURABILITY=SCHEMA_AND_DATA) GO INSERT INTO SampleTable1 (Column2,Column3) VALUES('Column1Value','Column2Value') INSERT INTO SampleTable1 (Column2,Column3) VALUES('Column1Value','Column2Value') INSERT INTO SampleTable1 (Column2,Column3) VALUES('Column1Value','Column2Value') |
Now we will enable the STATISTICS IO option and select the data of the memory-optimized table.
|
1 2 3 |
SET STATISTICS IO ON GO SELECT * FROM SampleTable1 |

As a result, the STATISTICS IO has not generated a report for the memory-optimized tables.
STATISTICS TIME is another option to report execution time statistics of the query.
Syntax:
|
1 |
SET STATISTICS TIME { ON | OFF } |
In the following query, we will enable the time statistics and then execute the query. When we open the Messages tab, we can see the output of the report.
|
1 2 3 4 5 6 7 8 9 10 11 12 |
SET STATISTICS TIME ON GO SELECT SalesDet.SalesOrderID, SalesOrderDetailID, CarrierTrackingNumber FROM Sales.SalesOrderHeader SalesH INNER JOIN Sales.SalesOrderDetail SalesDet ON SalesH.SalesOrderID = SalesDet.SalesOrderID INNER JOIN Purchasing.ShipMethod ShipMethod ON ShipMethod.ShipMethodID = SalesH.ShipMethodID WHERE ProductID < 999 AND ShipMethod.Name like 'CARGO%' |
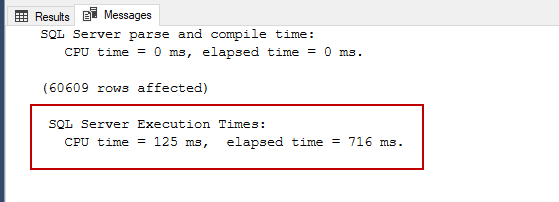
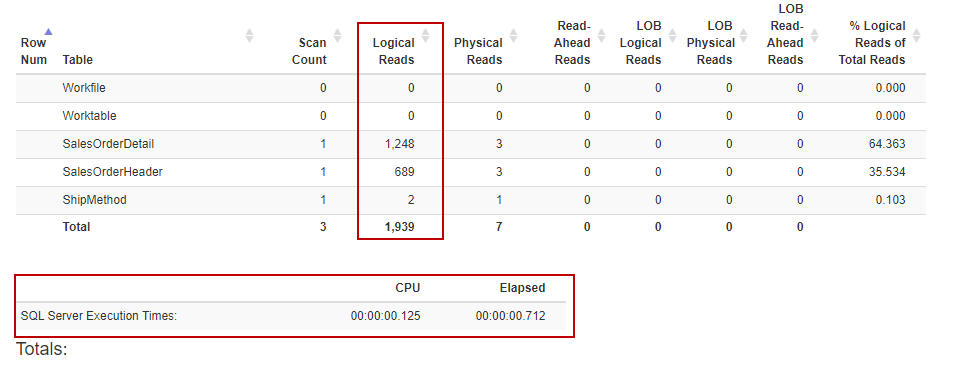
CPU time indicates the actual time that is consumed on CPU and elapsed time displays the total time taken for the completion of the query. At the same time, we can enable both IO and time statistics for the queries.
|
1 2 3 4 5 6 7 8 9 10 11 12 |
SET STATISTICS TIME, IO ON GO SELECT SalesDet.SalesOrderID, SalesOrderDetailID, CarrierTrackingNumber FROM Sales.SalesOrderHeader SalesH INNER JOIN Sales.SalesOrderDetail SalesDet ON SalesH.SalesOrderID = SalesDet.SalesOrderID INNER JOIN Purchasing.ShipMethod ShipMethod ON ShipMethod.ShipMethodID = SalesH.ShipMethodID WHERE ProductID < 999 AND ShipMethod.Name like 'CARGO%' |
When we convert this output with Statistics Parser, we will obtain a more understandable report.
Avoid using Non-sargable queries
Non- Sargable queries can’t use indexes efficiently so these types of queries waste the database resources. Actually, tuning these queries is not very difficult.
For example;
The following query retrieves the ProductNumber records which are the first two characters equals to ‘HN’ characters. With the help of the following query, we can retrieve this data.
|
1 2 3 |
SELECT ProductNumber FROM Production.Product WHERE SUBSTRING(ProductNumber,1,2 ) ='HN' |
Let’s try to understand the execution plan of the above query.
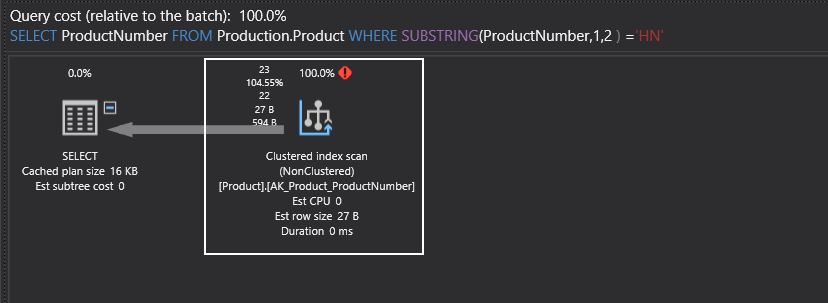
Clustered index scan operation reads index pages to find the matched records but it is not an effective way to retrieve the data. Now we will make a little change on the query and get rid of the SUBSTRING built-in function.
|
1 2 3 |
SELECT ProductNumber FROM Production.Product WHERE ProductNumber LIKE 'HN%' |
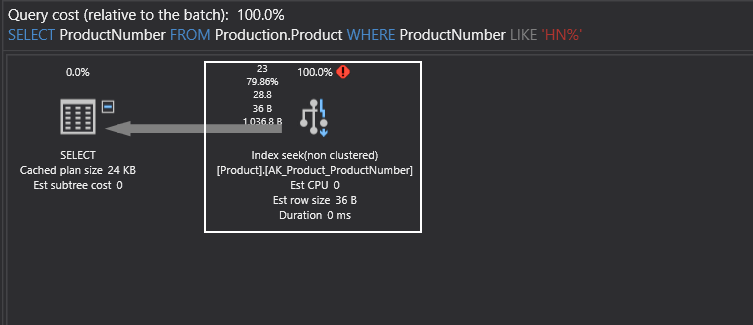
After changing the query condition with the LIKE operator, the query optimizer has decided to use an index seek operator. Index seek operator directly reaches the matched records and it is more efficient than the index scan operation. Now we will compare the IO statistics of these two queries. The non-sargable query makes 1209 logical reads.

On the other hand, the sargable query reads 58 logical pages.

Using the sargable queries can be a good option for the SQL Server query tuning.
- You can see the How to use sargable expressions in T-SQL queries; performance advantages and examples article to improve your skills about the sargable queries
Think twice before creating missing indexes
The execution plan is the most commonly used tool to understand the sequenced operation steps of the query and it is a vital helper tool for query tuning.
Sometimes execution plans of the queries suggest indexes for the executed queries. These missing index details are showed a green color text shows on the top of the execution plan. This index suggestion also displays the performance impact of the query when we create this index. The following image illustrates an example of the missing index that is generated by the execution plan.
When we click over the missing index, the index creation script will appear in another query window and we can give a name to this index and can create it.
However, before creating missing indexes we should think twice:
- Before creating the missing index, we have to consider the workload of the data manipulation queries (INSERT, UPDATE, or DELETE). Otherwise, we may observe a decrease in the performance of these queries
- By adding new included columns or index key columns, previous directories may be eligible for the executed query
- Make sure that the executed query will not be used only several times
On the other hand, SSMS visual execution plan only displays a single missing index but when we analyze the execution plan details, we can face a surprise about this issue. Now we will enable the actual execution plan and execute the following query.
|
1 2 3 4 5 6 7 8 9 10 |
SELECT SalesDet.SalesOrderID, SalesOrderDetailID, CarrierTrackingNumber FROM Sales.SalesOrderHeader SalesH INNER JOIN Sales.SalesOrderDetail SalesDet ON SalesH.SalesOrderID = SalesDet.SalesOrderID INNER JOIN Purchasing.ShipMethod ShipMethod ON ShipMethod.ShipMethodID = SalesH.ShipMethodID WHERE ProductID < 999 AND ShipMethod.Name like 'CARGO%' |
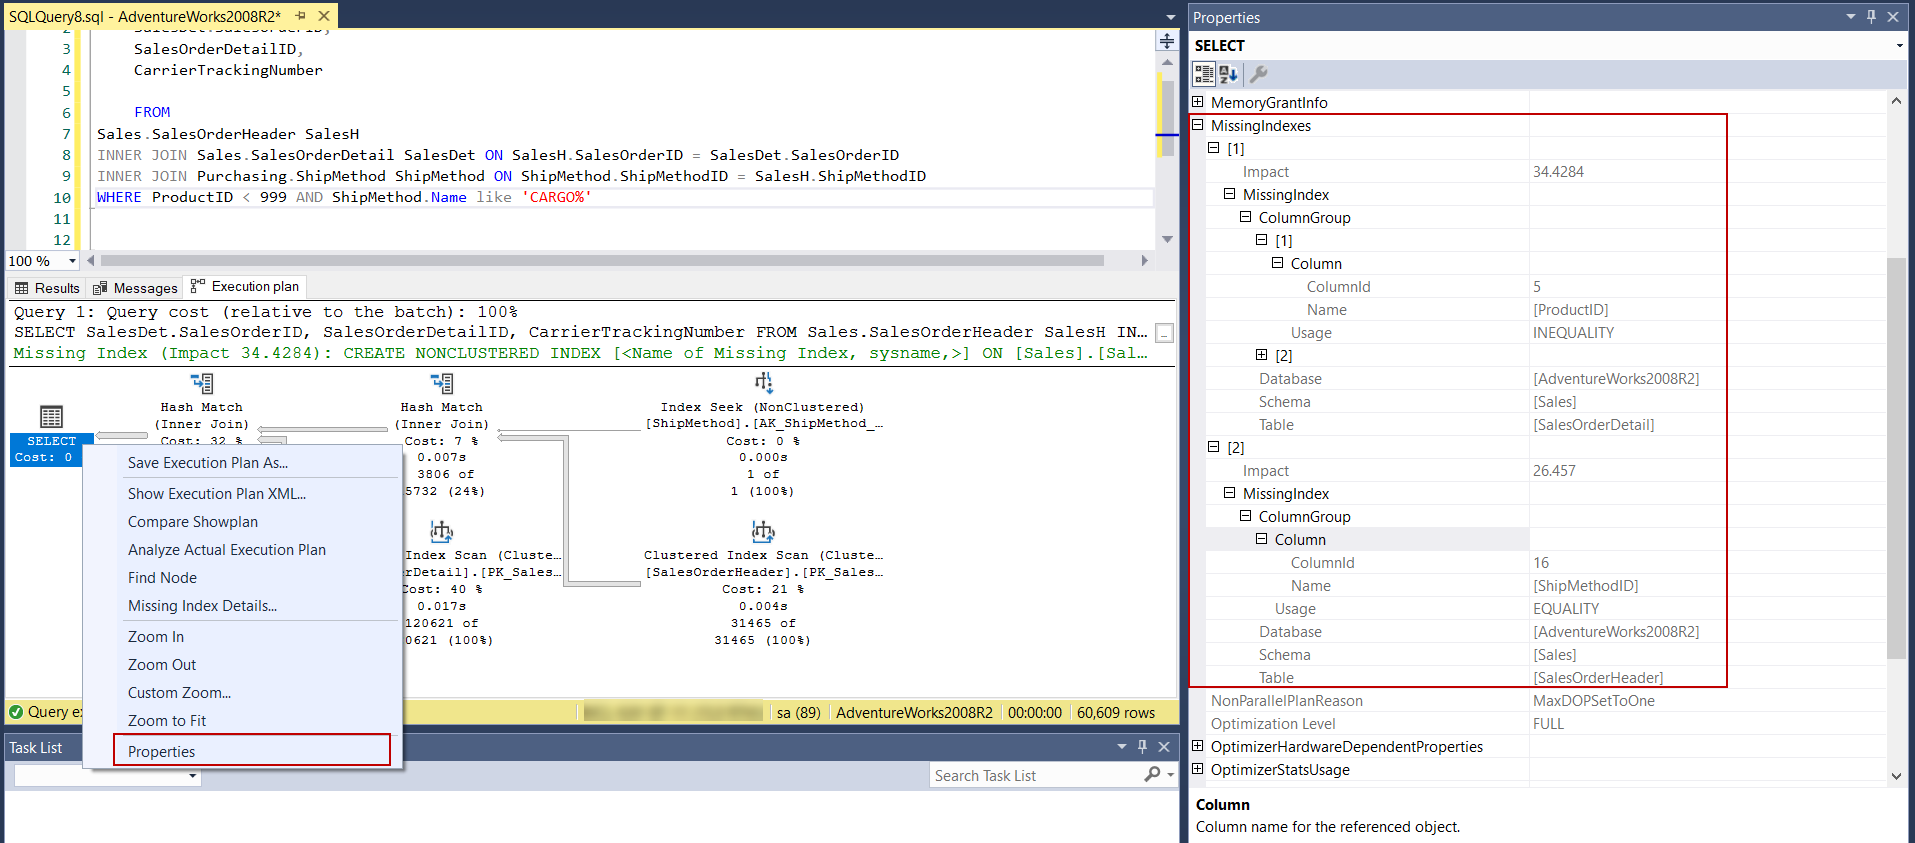
As we can see, SQL Server Management Studio only displays a single missing index suggestion. However, when we right-click on the SELECT operator and select the Properties menu and look at the MissingIndex property option, we will find out more than one missing index suggestion.
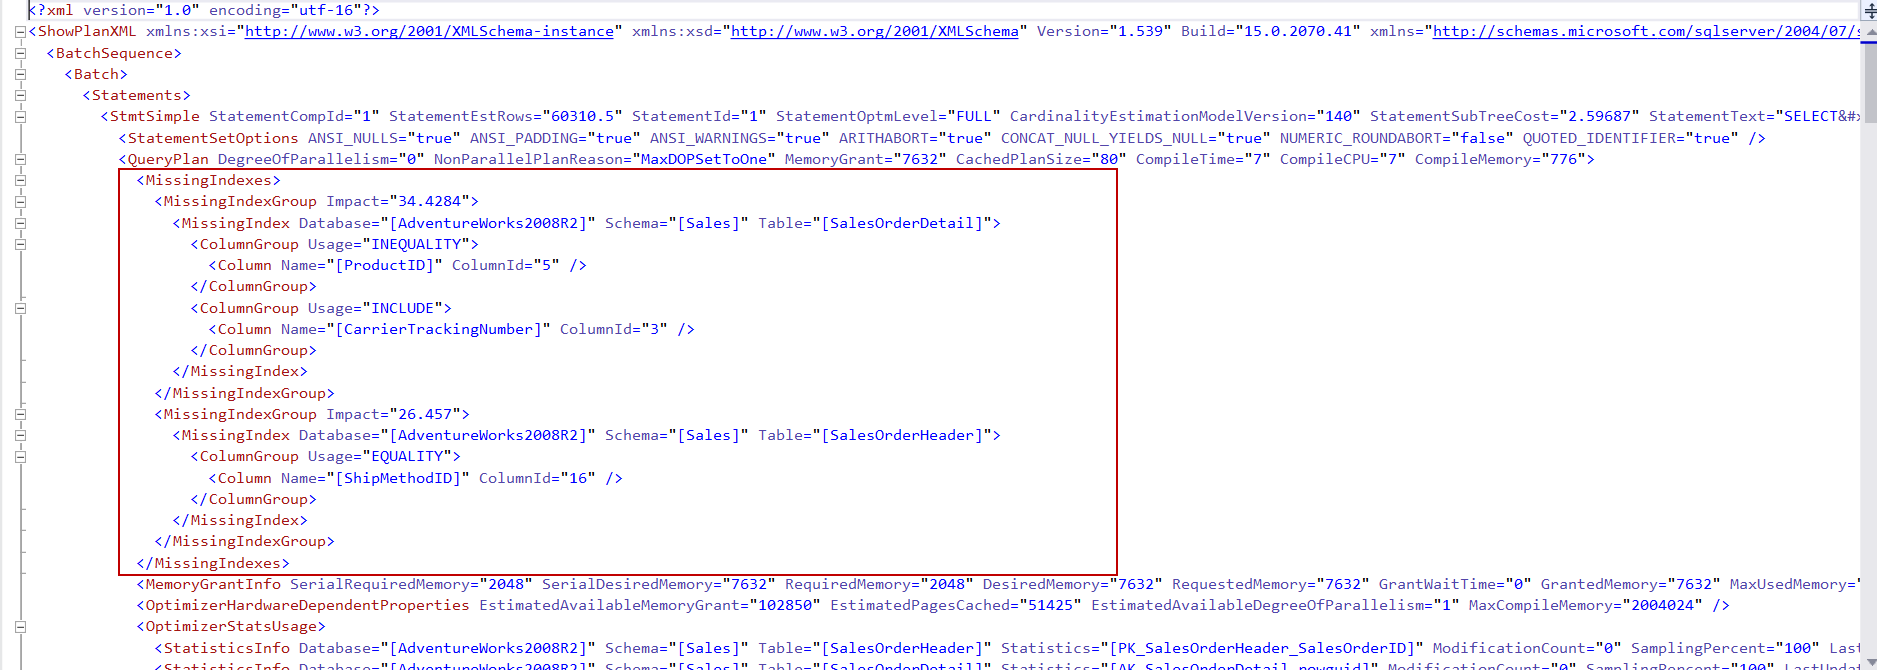
As a result, we should check missing index details of the last operator of the execution plan if any index suggestion is available. Also unlike visual representation of the execution plan, Plan XML can display multiple index suggestions.
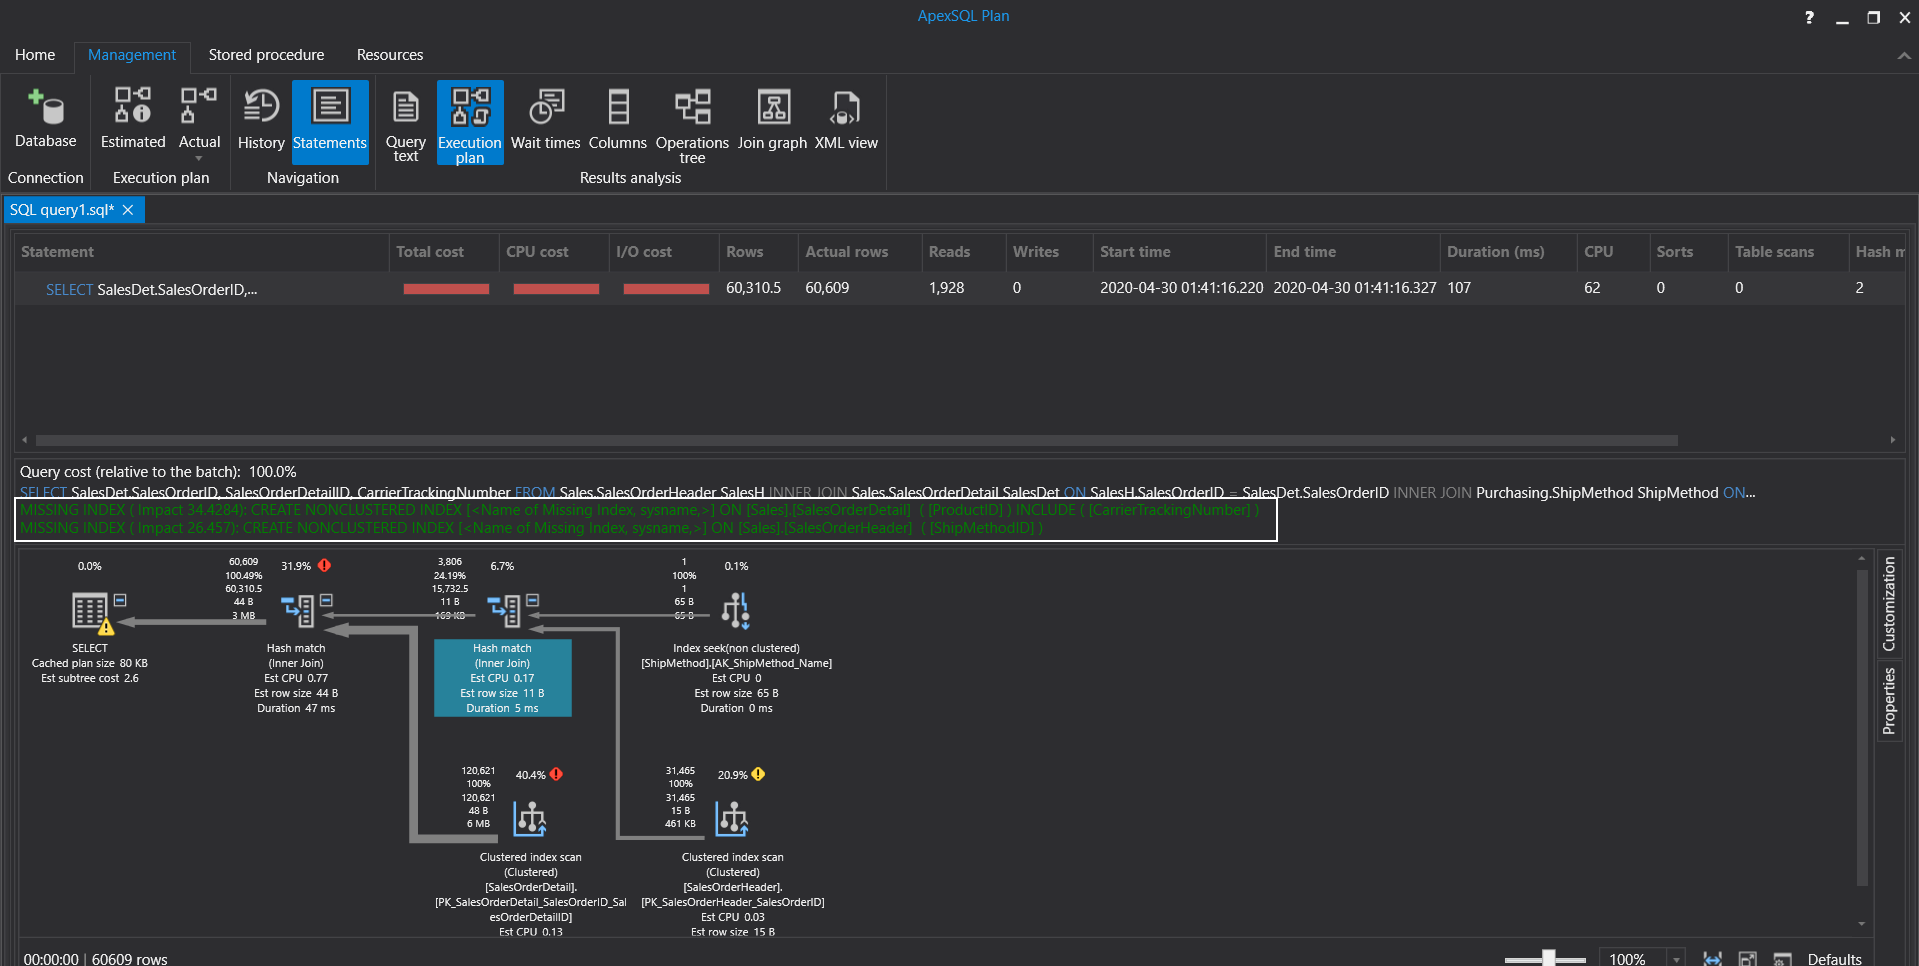
We can use the ApexSQL Plan instead of using SQL Server Management Studio (SSMS) execution plans because ApexSQL Plan displays reliable results about the missing index suggestions. When we execute the same query on the ApexSQL Plan and it displays 2 separated missing indexes.
Conclusion
In this article, we learned 3 essential techniques that help to tune query performance. SQL Server query tuning is a very compelling issue and every different query requires different tune approaches but some outlines never change and with this article we learned these essential methods.
- SQL Performance Tuning tips for newbies - April 15, 2024
- SQL Unit Testing reference guide for beginners - August 11, 2023
- SQL Cheat Sheet for Newbies - February 21, 2023


