In this article, we will discuss the SQL Server Reporting Service Report Builder and look at how to handle common client, end user requests using Report Builder. Report Builder is a very powerful tool to create a report for the SQL Server Reporting Service.
Advantages of the Report Builder is that it:
- exists as a Stand-alone installation
- can use different data from a lot of data sources
- can easily deploy reports to SQL Server Reporting Service
- supports full capabilities of SQL Server Reporting Service
- provides a productive report-authoring environment
After that, we will demonstrate how to handle problems that may arise from the client or business.
Because when we create a report for clients, they can request very different features. Our scenario is that we have a client who sells the product to different countries, so we are developing a report for this client. We will find a solution for different needs of this client.
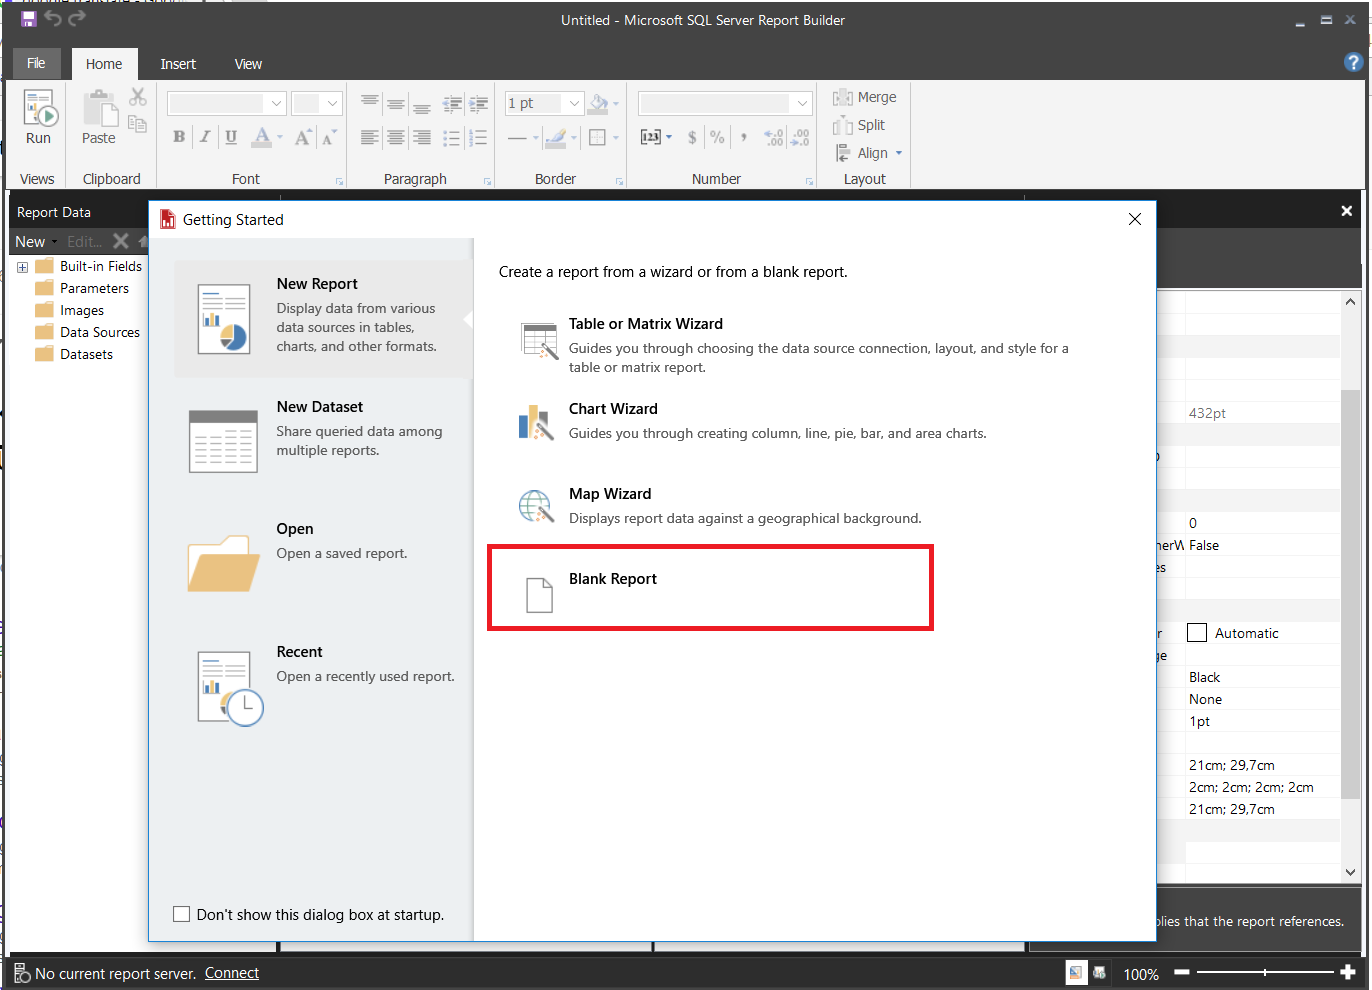
You can download Report Builder 2017 in this link and you can install it. At the startup, a screen comes up like below. In this screen, we will click blank report and create a new report.
We will create sample sales data and retrieve data to report.
|
1 2 3 4 5 6 7 8 9 |
CREATE TABLE SalesCurrency (ID INT IDENTITY(1,1) PRIMARY KEY, SalesAmount FLOAT , Cur VARCHAR(10),mail VARCHAR(50)) INSERT INTO SalesCurrency VALUES (20,'USD' ,'testQQtest.com') ,(10,'GBP','sample.sample.cox'), (60,'EUR','invalidemail@h.cooom'), ('15','JPY','invalid@lll.coz'),('92','EUR','ppl@test.com') |
Client Request: Could you show my different currency sales in USD and exchange the real-time currency rates?
Response: Yes, we can handle this problem in three steps on Reporting Builder!
What to do?
- We will create an XML datasource that retrieves the daily exchange rates
- We will create a dataset and connect this dataset to XML data source
- We will use lookup function and exchange all different currency sales to USD
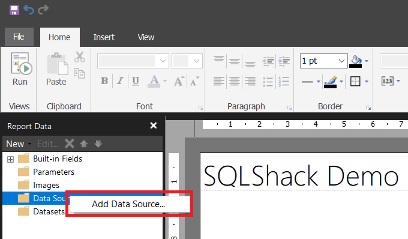
First of all, we will add a datasource to our report.
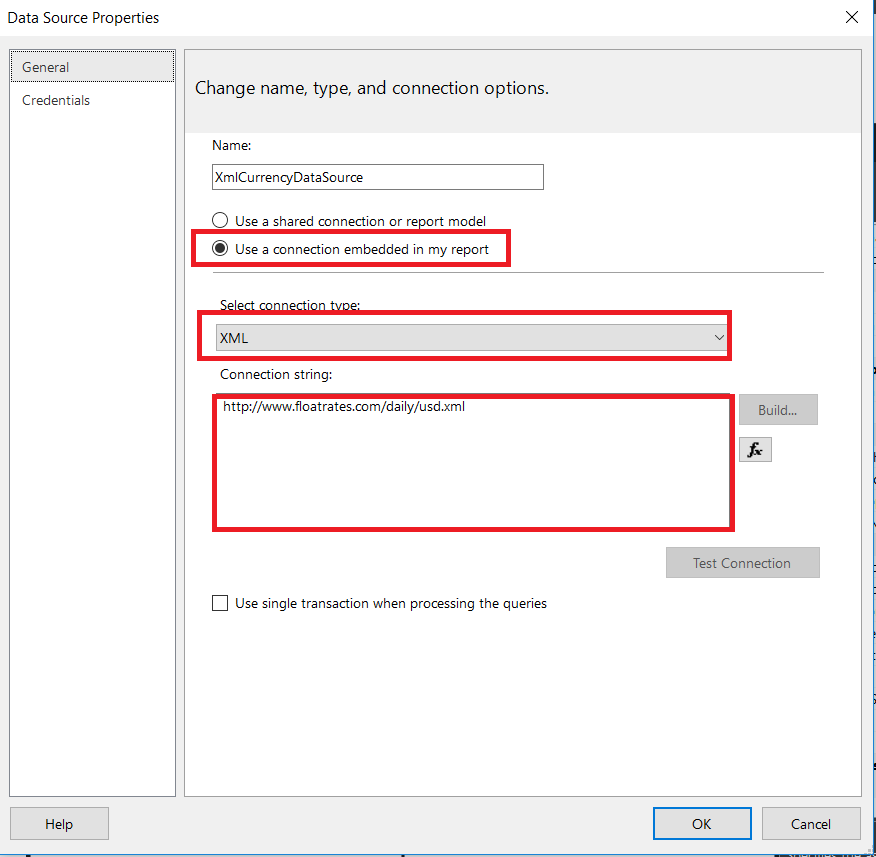
Then we will select XML connection type and setup a connection string which returns exchange rates. This link will return USD exchange rates. You can find a lot of links which returns exchange rates in different currencies.
We will add a dataset, connect this dataset to XML datasource and click refresh fields.
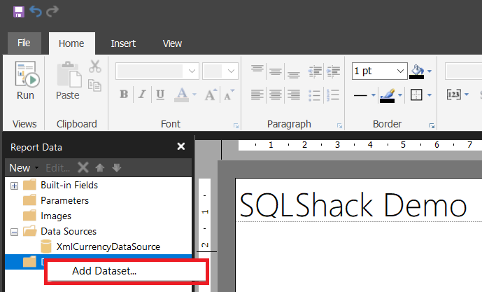
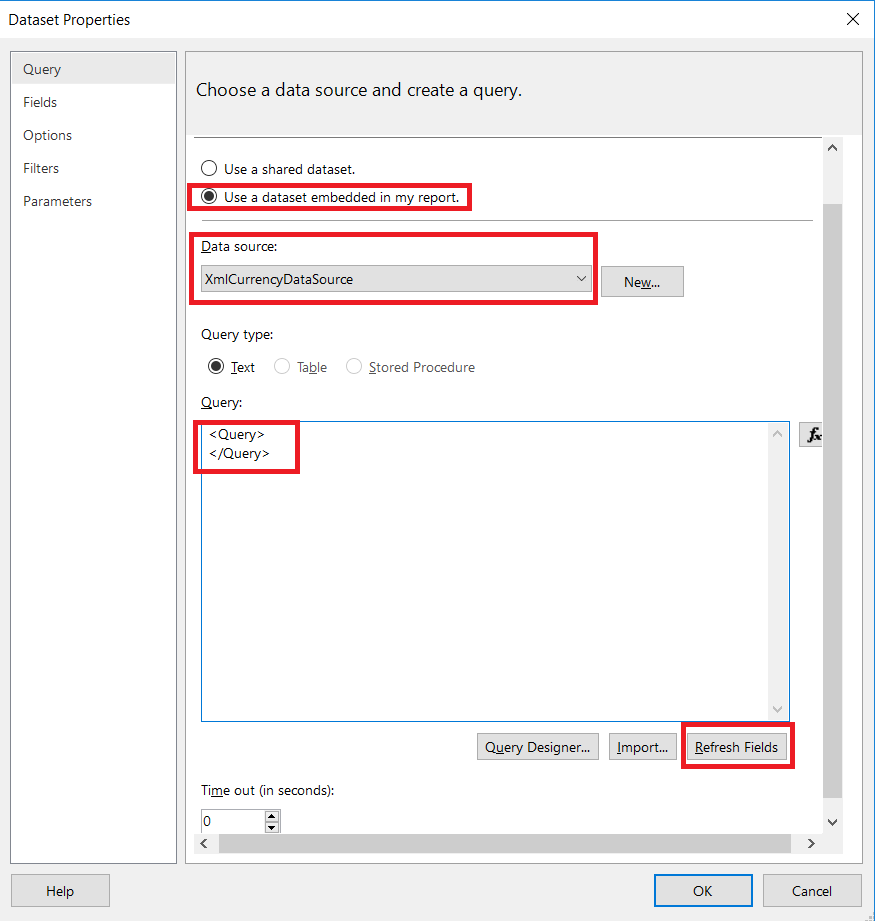
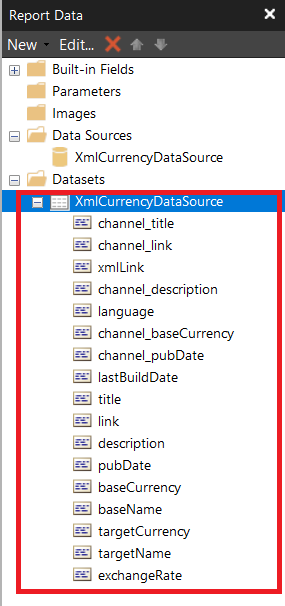
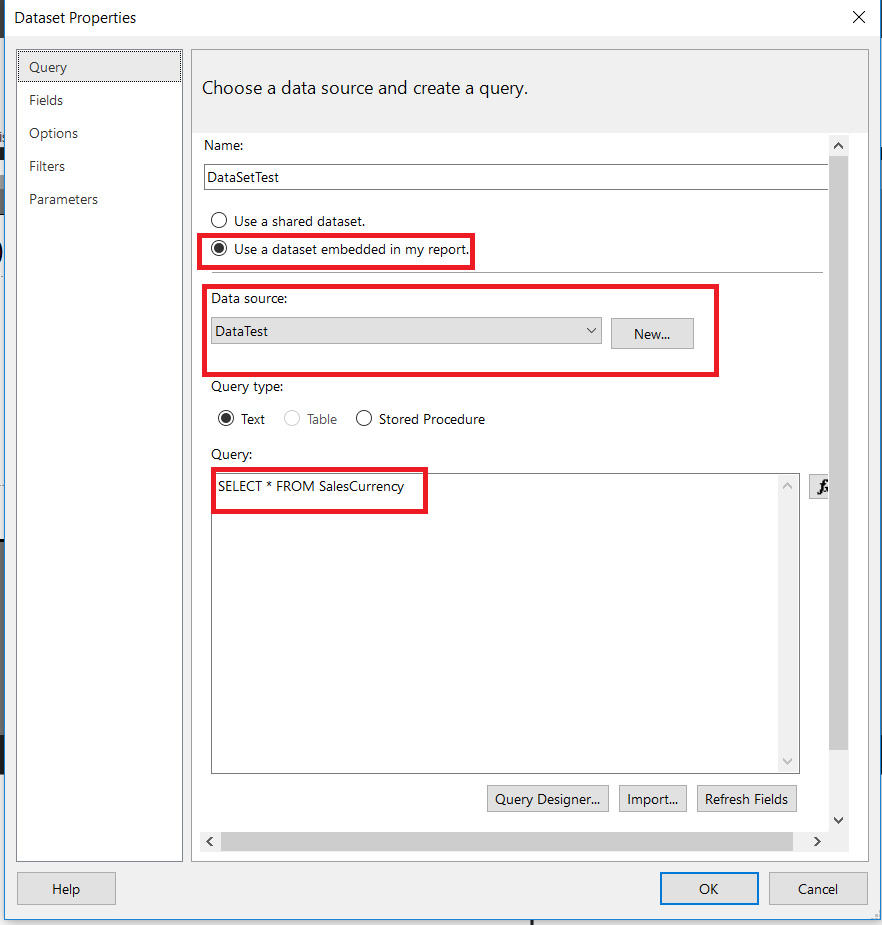
Now our XML dataset is ready. We will add new datasource and dataset which retrieves sales data from SQL Server database.
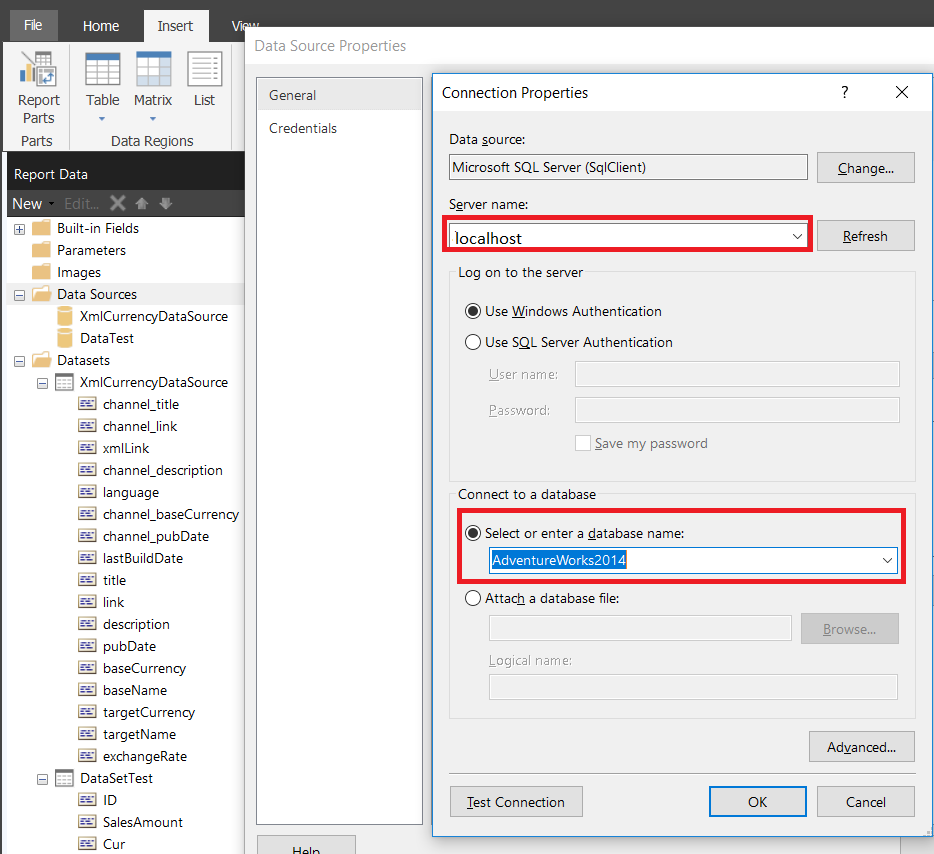
We will write our query to query textbox.
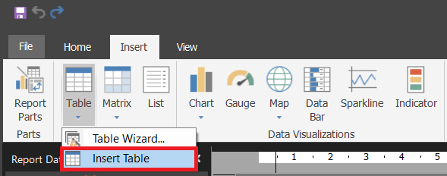
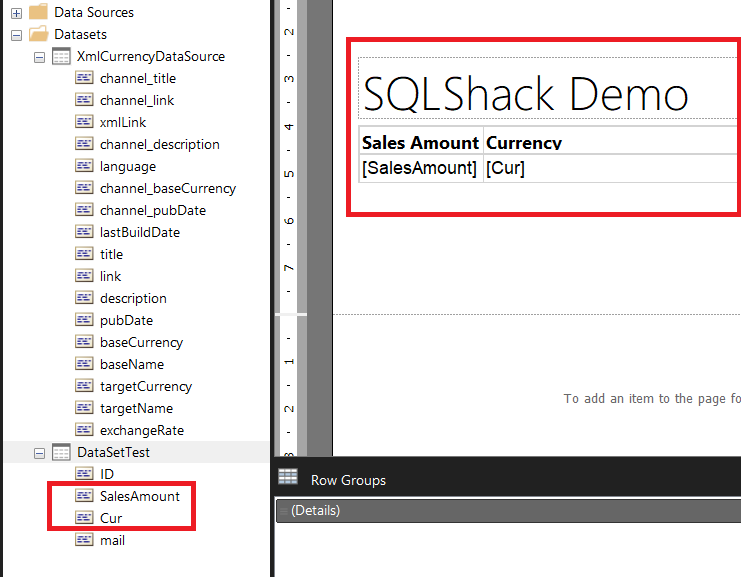
We will add the table and then drag and drop “SalesAmount” and “Cur” fields to table.
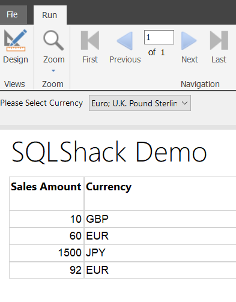
When we run the report, it will look something like this.
The most important point in this demo is that we will use the Lookup function. The Lookup function helps us to return matching exchangeRate from XML datasource. It means that the Lookup function helps to find matching values from a different dataset.
The Lookup function gets the following parameters:
- Lookup(source_expresion,destination_experission,result_experssion,dataset)
- source_expresion : specify the value that we want to lookup. In our example, this value would be “Currency” column.
- destination_experission : specify the value that we have to match from source dataset. In our example, this value would be “TargetCurrency”
- result_experssion: specify the value which we want to return. In our example, this value would be “exchangeRate”
- dataset : specify the destination dataset name.

Now, we will add a new column to the table and write the Lookup function and exchange currency to USD.
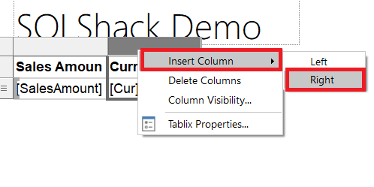
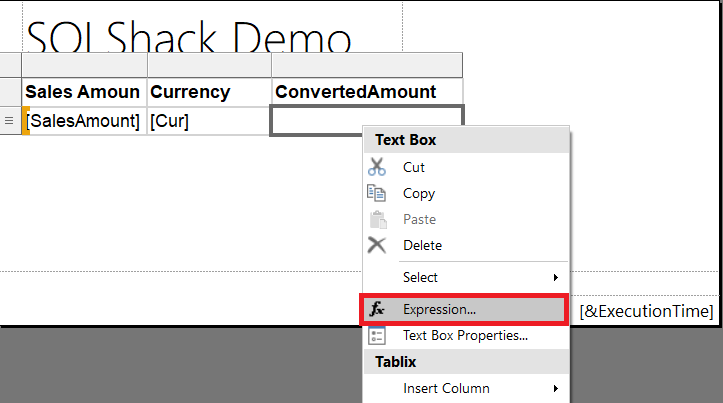
We will write Lookup experession for converting sales amounts to USD.
Fields!SalesAmount.Value*IIF(Fields!Cur.Value=”USD”,1,Lookup(Fields!Cur.Value,Fields!targetCurrency.Value,1/val(Fields!exchangeRate.Value), “XmlCurrencyDataSource”))
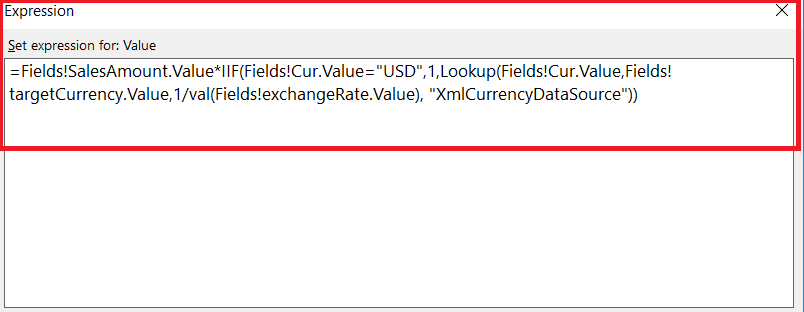
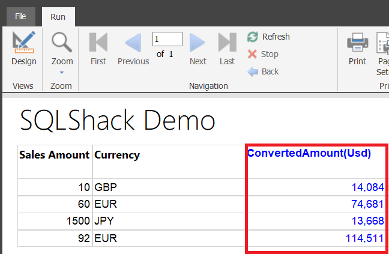
Finally, our report will show converted sales amount.
Client Request: Can you validate an email address using regex function?
Response: Yes, we can handle this problem by creating custom code using regex.
What to do?
- We will write custom function code in report builder.
- We will use a custom function in the report.
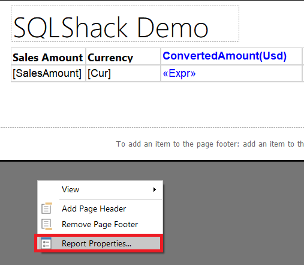
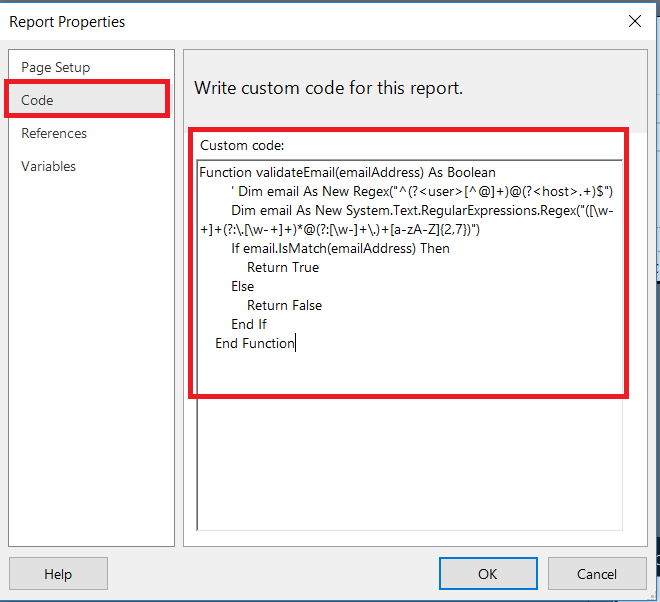
Now we will open report parameters and then click code tab. We will add custom function code which will validate e-mail addresses. In Report Builder we can use VB.net code.
|
1 2 3 4 5 6 7 8 |
Function validateEmail(emailAddress) As Boolean Dim email As New System.Text.RegularExpressions.Regex("([\w-+]+(?:\.[\w-+]+)*@(?:[\w-]+\.)+[a-zA-Z]{2,7})") If email.IsMatch(emailAddress) Then Return True Else Return False End If End Function |
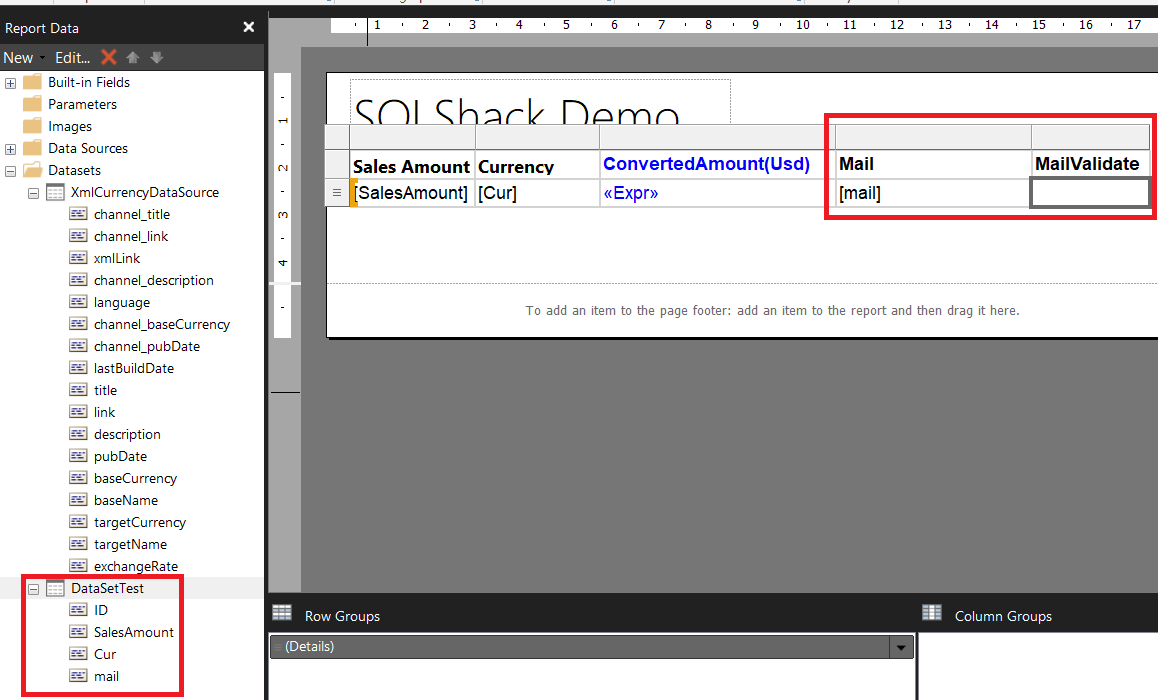
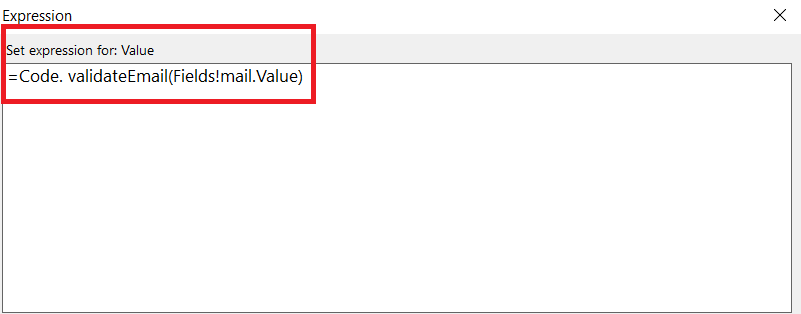
In this step, we will add two columns into the table which are “Mail” and “MailValidate” columns. We will write an expression for “Mailvalidate” column.
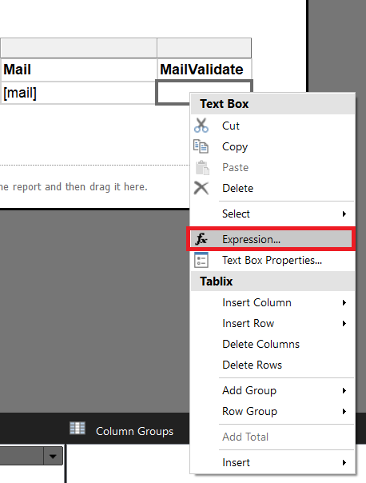
We will set expression for “MailValidate” column. This custom function will use our custom code and check mail validation.
And finally, we will run our report.

Client Request: Can you add filter sales currency with multiple parameters and show selected parameters?
Response: Yes, we can handle this problem to add multiple parameters.
How will we solve this?
- We will add a report parameter
- We will get report parameter values from XML data source
- We will filter sales with this parameter
Now we will add report parameter and get parameter values from XML data source
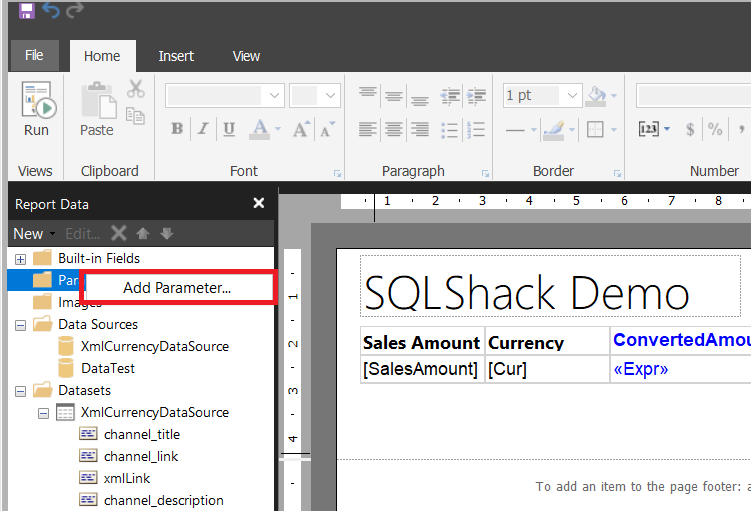
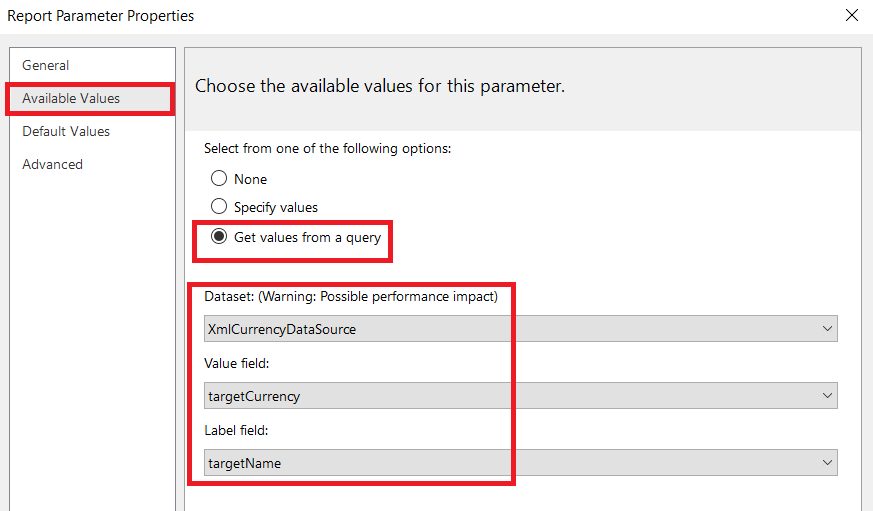
We will select “Available Values” tab and chose “Get values from a query”. Then, we will select XML dataset and set the “Value Field” and “Label Field”.
The Value field defines a value which filters the dataset
The Label field defines a text which is shown in parameter description
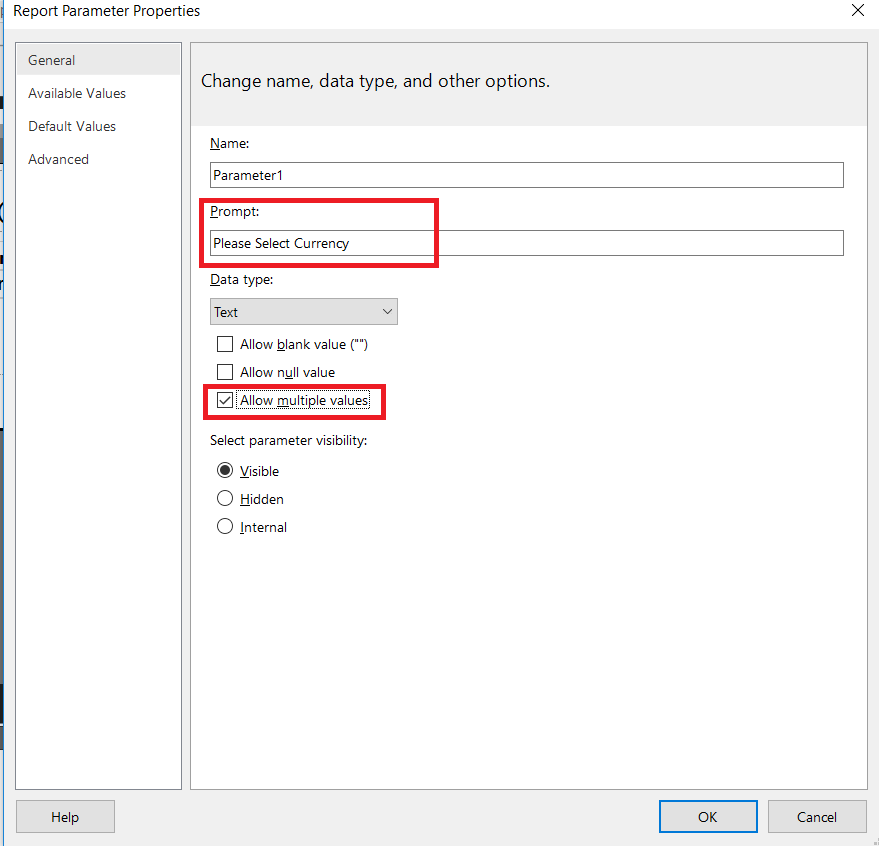
We will set multiple “Allow multiple values”. This parameter lets us to select multiple values in the parameter. The “Prompt” text box defines a text which is shown in report parameter.
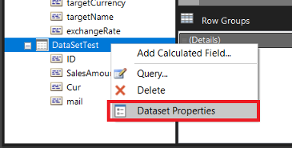
In this step, we will filter the sales dataset. We will open the dataset properties.
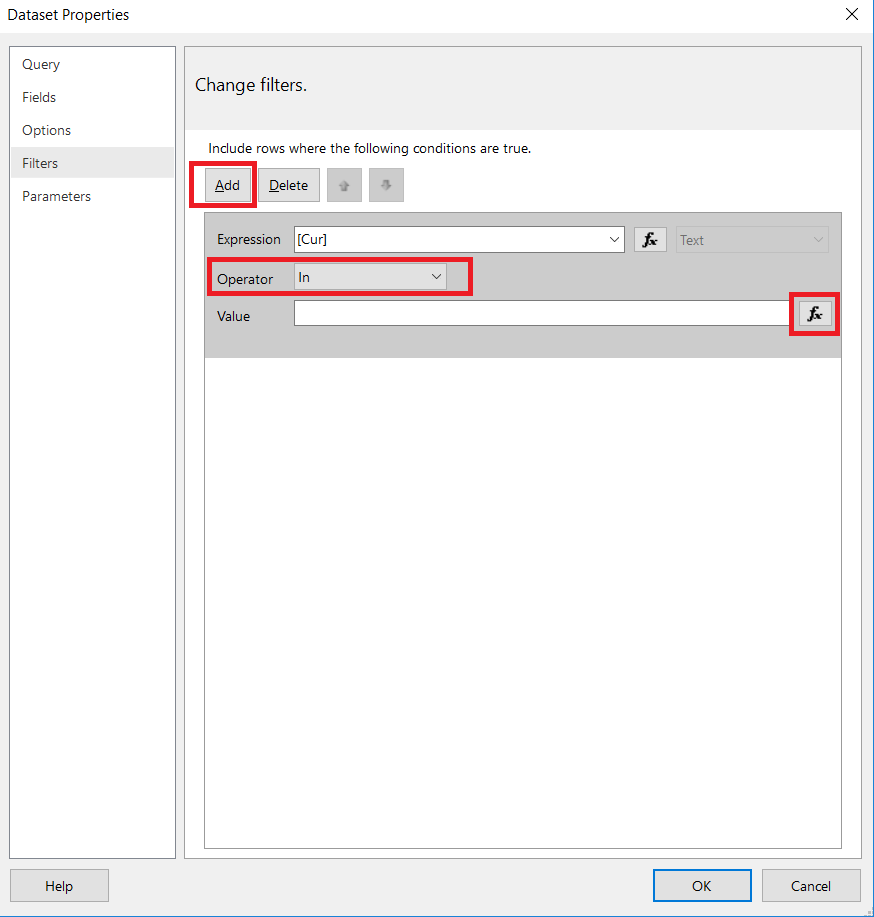
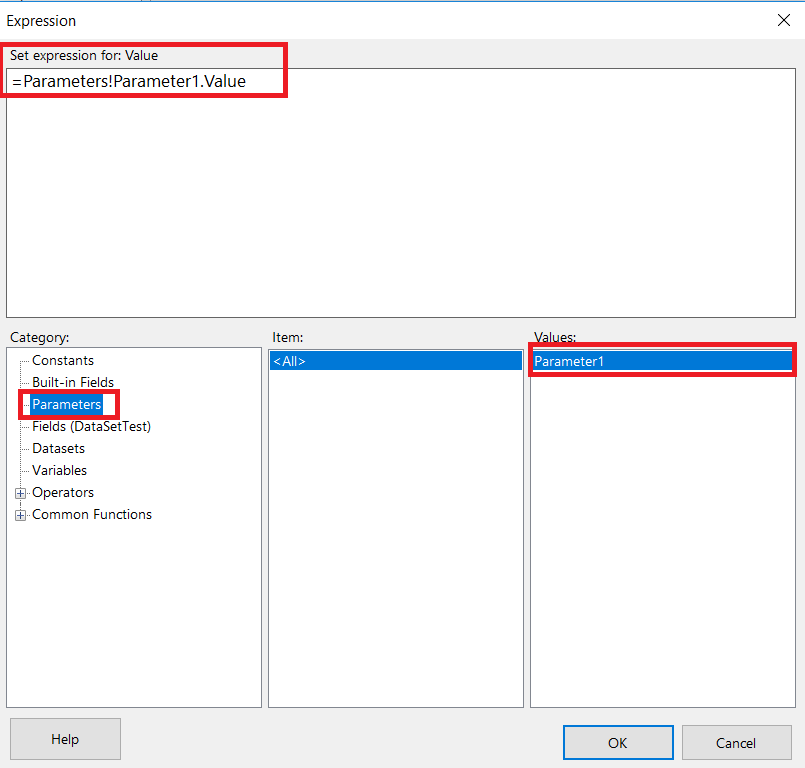
In “Filters” tabs we will add new filter expression and set report parameter to this expression. Here, we will use “In” operator because we want to select multiple parameters.
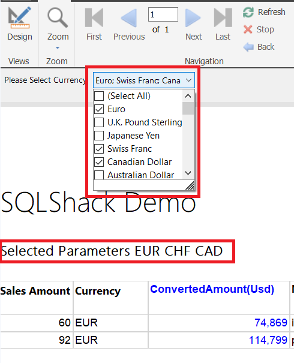
When we run the report, we are able to see report parameter. This parameter will filter the report.
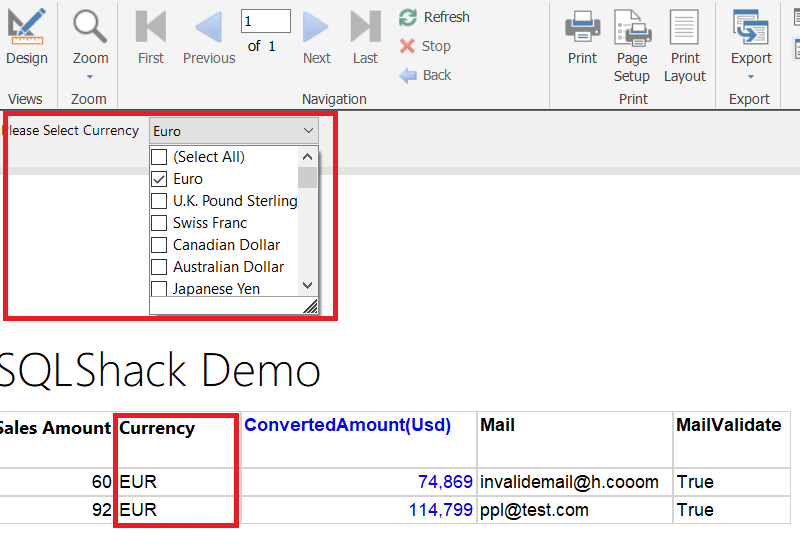
If we want to show selected values, we have to use join function. And after that, we will add a text box to report and write a join expression.

How to open Reporting Service reports and deploy reports
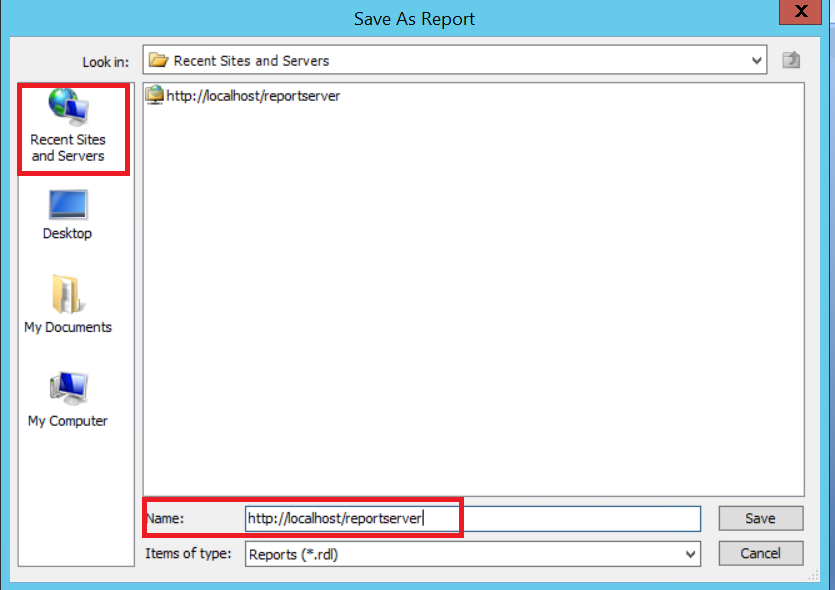
If we want to deploy reports to Reporting Services, we will select “File tab” and select “Save As” and then select “Recent Sites and Servers”. We will include the Reporting Service URL.
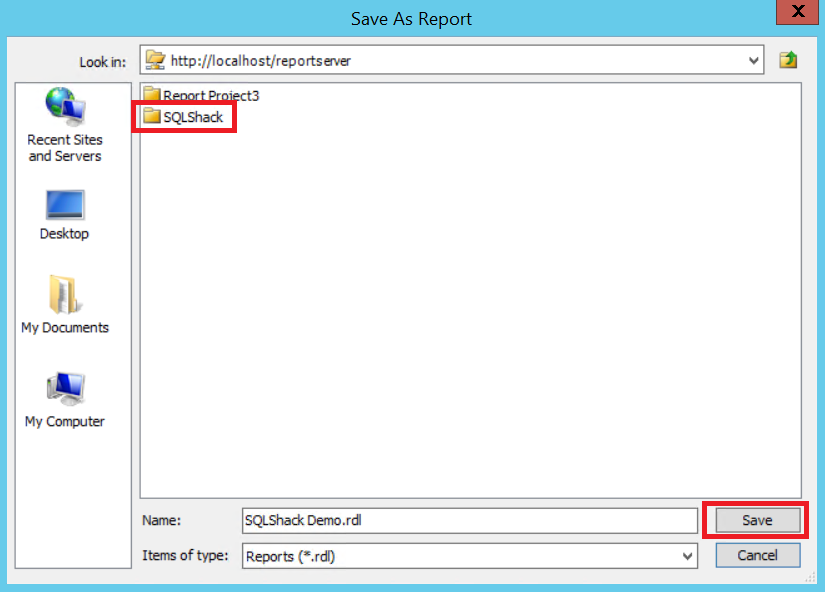
And then select the folder and save the report.
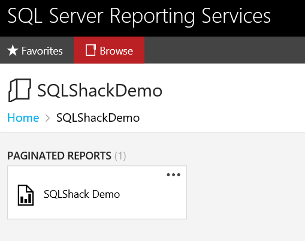
Finally, our report is ready to use in Reporting service.
Conclusion
In this article, we focused on SQL Server Reporting Service Report Builder. This light-weight tool helps us to create reports and publish reports to Reporting Service. If companies are using Reporting Service in their reporting and business intelligence solutions, the Report Builder can provide for creating reporting or self-service BI (Self-Service BI approach helps business users to develop their own reports without the need of IT department. With this approach, business users get rid of dependence on IT department.).
References
- Expression Examples (Report Builder and SSRS)
- Report Builder Functions – Lookup Function
- Adding Parameters to Select Multiple Values in a List (SSRS)
- SQL Performance Tuning tips for newbies - April 15, 2024
- SQL Unit Testing reference guide for beginners - August 11, 2023
- SQL Cheat Sheet for Newbies - February 21, 2023

