This article gives an overview of viewing execution plans in the Azure Data Studio.
Introduction
Database administrators use a query execution plan for troubleshooting query performance issues. Suppose one day a user calls you and says my query is running slow. You might perform several checks such as blocking, deadlock, CPU, memory, IO utilization, waits etc. You can also capture the query execution plan to check the overall flow of the query internally. You get detailed information in the plan.
We can get two formats of a query execution plan:
Graphical: it gives a graphical representation of all operators, their properties, tooltip information. We can interpret results quickly in a graphical format
XML format: It shows a query plan in an XML format. It gives detailed information, but you should be an experienced DBA to understand it
You can check out the following articles to get a detailed knowledge of execution plans.
SQL Server provides the following types of query plans:
- Estimated execution plan: SQL Server generates the query plan without actually executing the query
- Actual execution plan: It is an actual representation of a query plan that SQL Server generates by executing the query
You can go through SQL Server Execution Plans types for comparison of an estimated and actual query plan. Usually, DBA uses SQL Server Management Studio or third-party tools such as ApexSQL Plan to check query plans.
Azure Data Studio is a new tool from Microsoft that you can install on Linux as well. It also provides several useful features such as code snippets, Integrated terminals (SSH and PowerShell), extensions, query charts, various results format, server dashboard. SQLShack has many useful articles for Azure Data Studio.
Suppose you are using Azure Data Studio and you need to view both estimated and actual query plans. Do we have a way to check a query plan in ADS? Does it provide any additional features in comparison with SSMS plans? Let’s check it out.
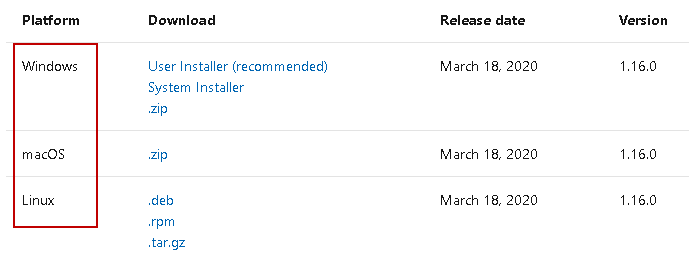
You should install Azure Data Studio’s latest release before going through this article. Launch URL, choose your platform and download installer. You can also use the Windows user installer (recommended) because it does not require a user with administrative rights.
Launch ADS and connect to a SQL Server instance. In this article, I am using the [AdventureWorks] sample database.
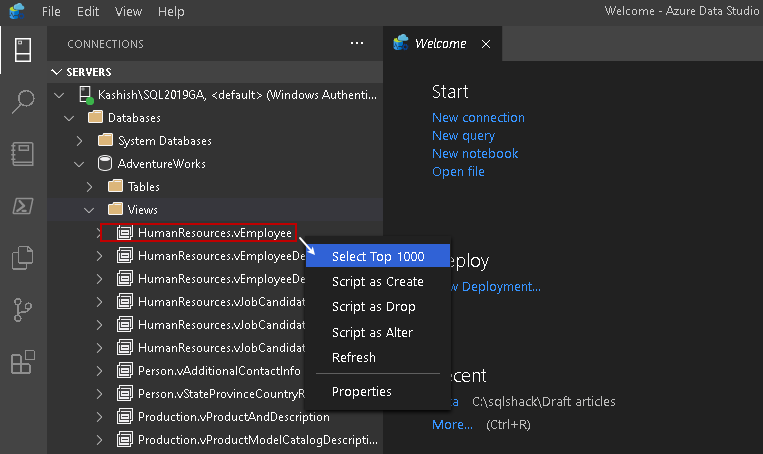
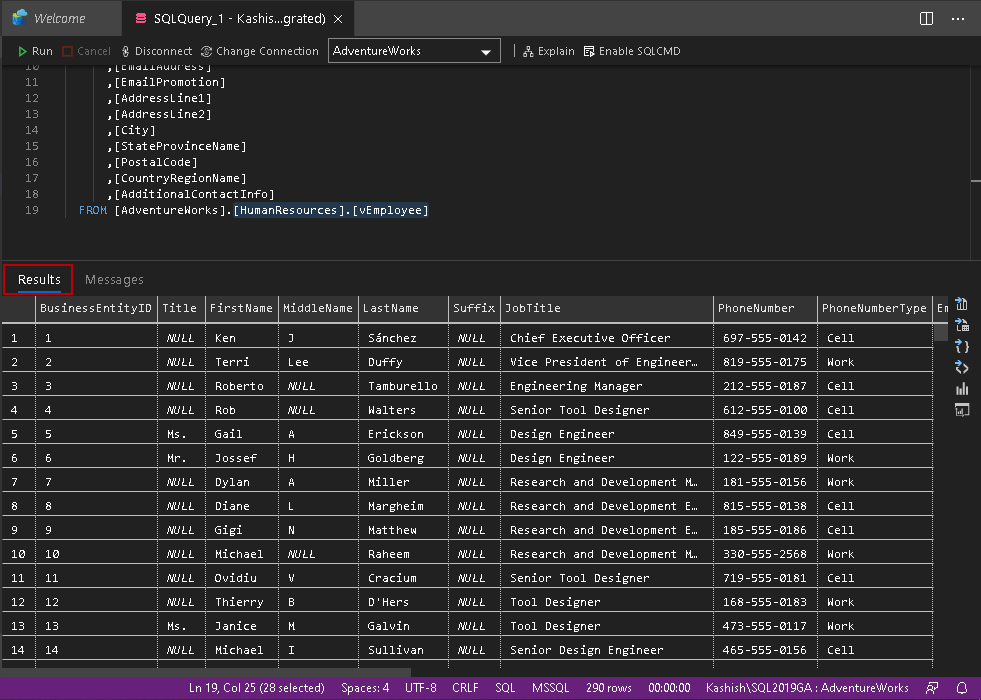
Expand the database and right-click on [HumanResources].[vEmployee] view to select the top 1000 rows using the highlighted option below.
It executes the query, and you get results in a grid format, as shown below.
In the Query menu, click on the Explain option at the top of the query window.

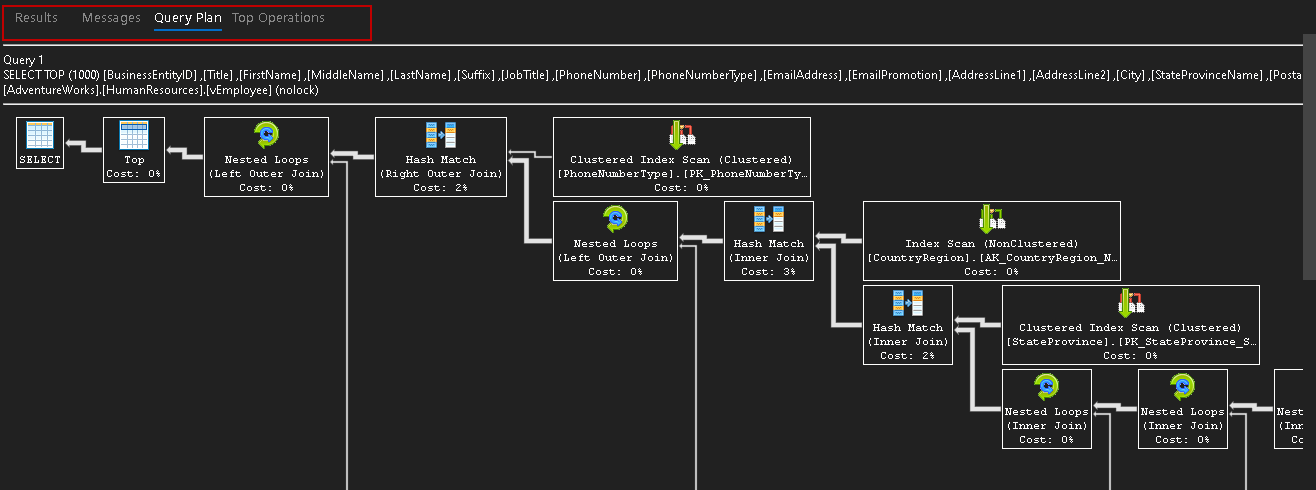
Click on the Explain, and it shows the execution plan in a Query Plan tab.
We get an estimated execution plan in graphical format using this Explain option. You do not see query results (output) because SQL Server does not execute the query in the estimated query plan. If we want to see the XML query plan, we can get it from the Result tab.

To view completed XML plan, click on the XML and you get the full XML view with a beautiful color coding.

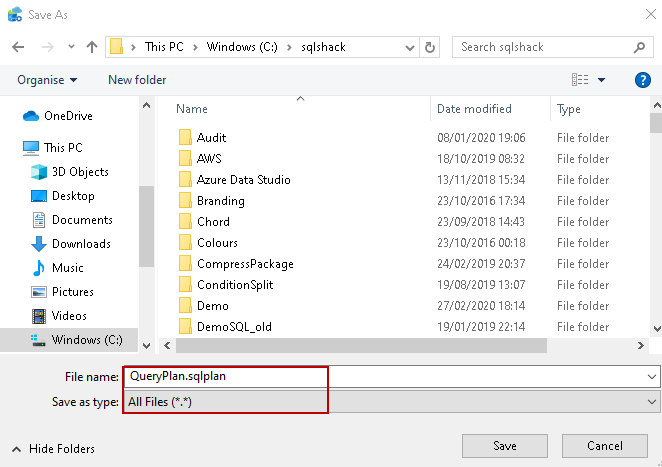
We can save this XML plan with a *.sqlplan extension for future usage. To save this plan, go to File-> Save As.
Specify a file name with *.sqlplan extension in a required directory.
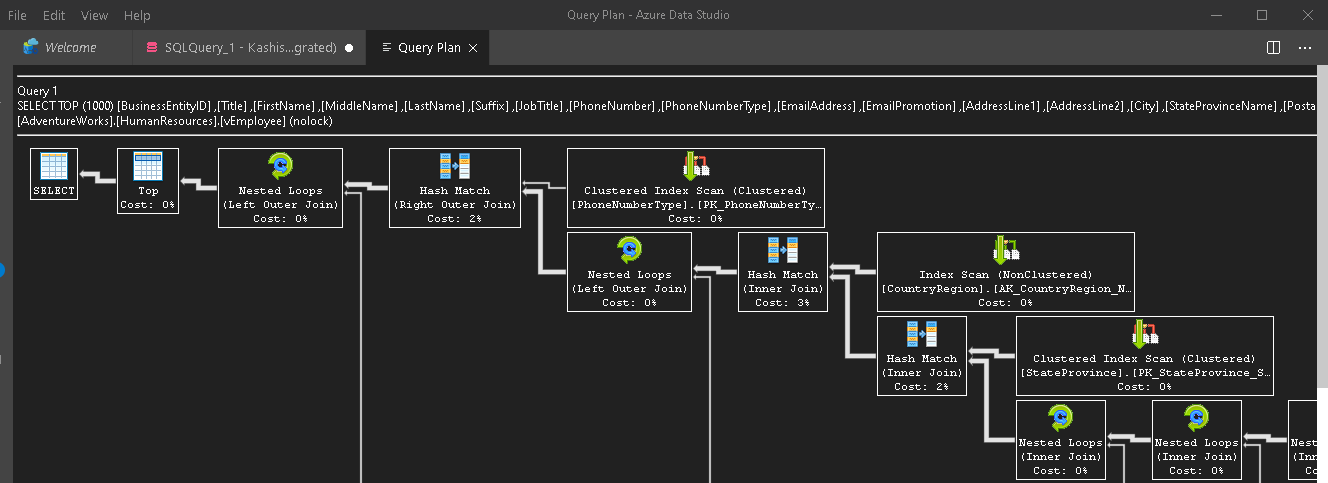
Once you save the execution plan, it opens the following graphical format. We cannot get the top operators from this saved plan.
You should read a graphical execution plan from right to left direction because data flow happens in that direction. You can go through the article How to Analyze SQL Execution Plan Graphical Components to understand it in a detailed manner.
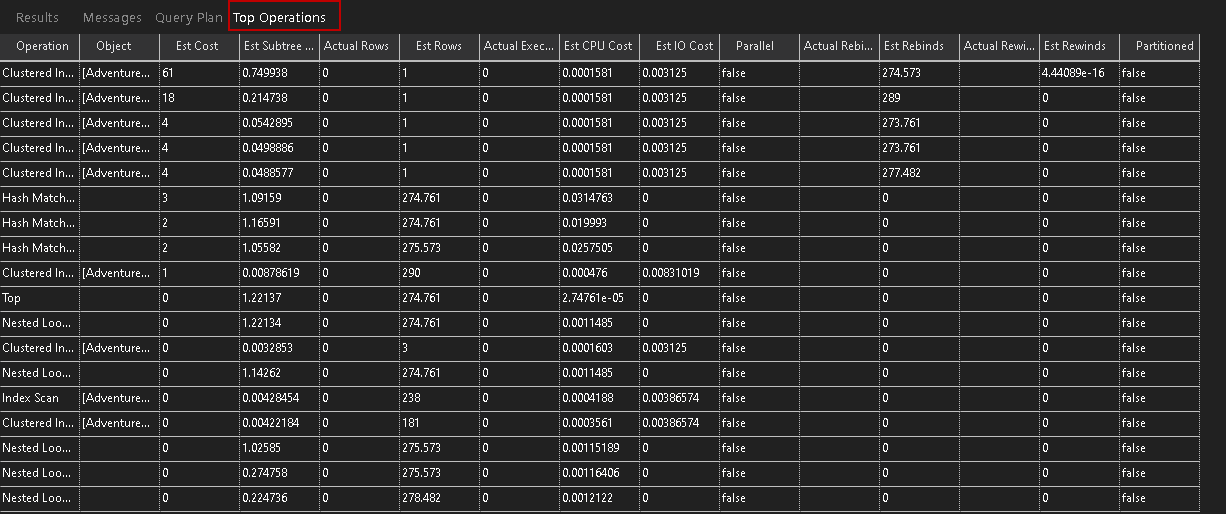
For a long query, we might see a complicated execution plan with a large window. You might face difficulty to analyze the costly operators associated with the query. Azure Data Studio provides a solution for this as well. You see an additional tab Top Operations to check all operators and their costs in a tabular format.
Click on the Top Operations, and you get the following output.
It is an interactive window to check the operators. You can click on any column and sort the output in a descending or ascending order.
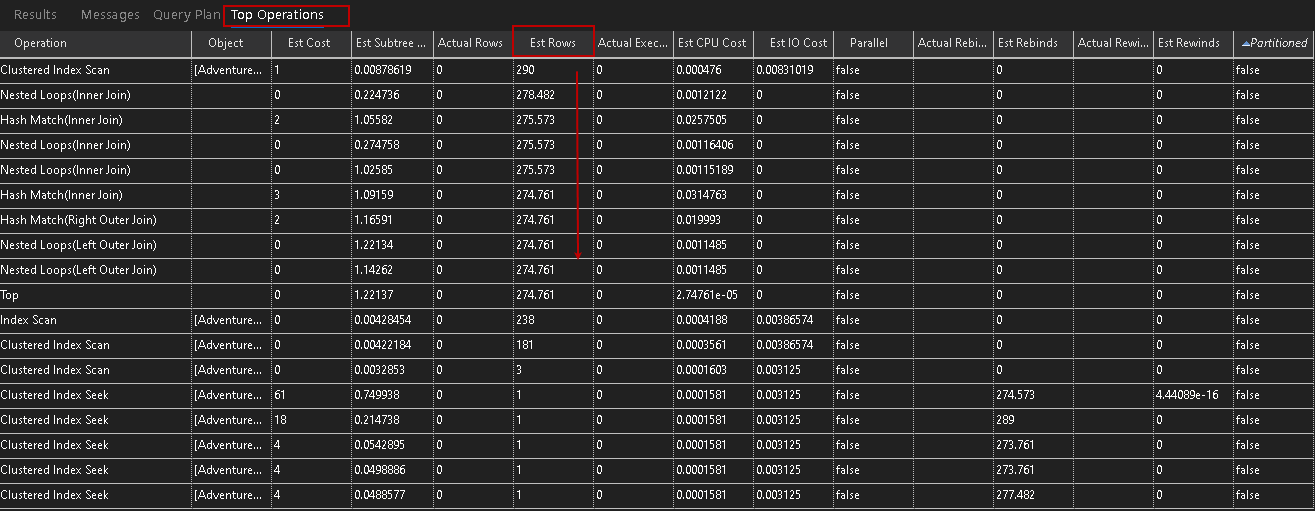
For example, if we want to sort this table based on estimated rows flowing through each operator. Click on the Est Rows column, and it sorts results accordingly.
Similarly, we can sort results according to the Est Costs of plan operators.
It is an excellent way to identify the costly operators taking most of the resources and time. You can go back to the graphical plan to check more details around that identified operator.
Get Actual Execution Plan in Azure Data Studio
As we see earlier, the Explain option gives you an estimated query plan. In most cases, we prefer to get the actual execution plan and investigate it further. I would recommend to use the actual execution plan as well so that you can get an idea of what caused the query to behave slowly.
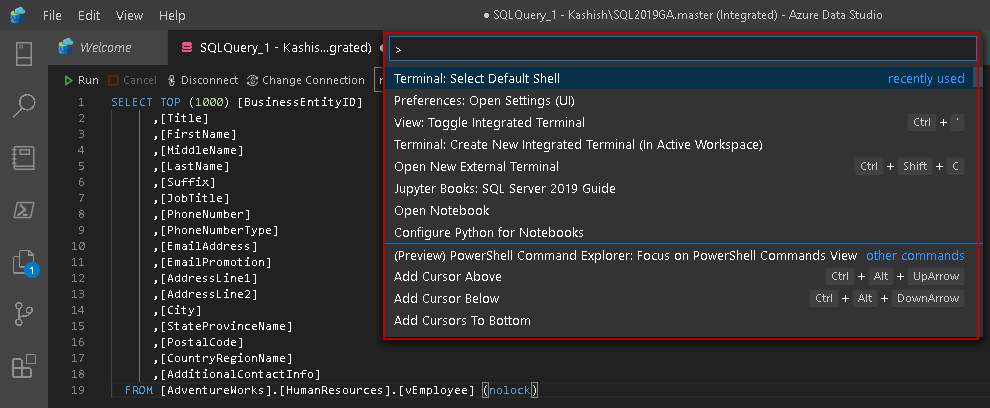
To get an actual query plan, first, write the query in a new query window and then go to View -> Command Palette.
It opens the list of available commands, as shown below.
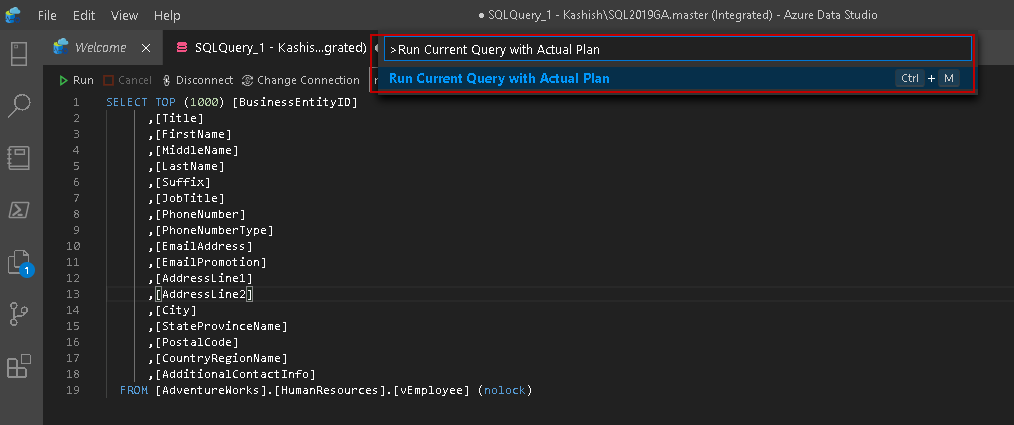
Type Run Current Query with Actual Plan and click on the highlighted option.
You can use keyboard shortcut CTRL+M to execute the query and get an actual execution plan, as shown below.
You get similar options as of the estimated query plan. In the result pane, you get the query result as well as the XML query plan in Azure Data Studio.
Conclusion
In this article, we explored ways to view the estimated and actual execution plans in the Azure data studio. We also viewed ways to get graphical and XML plan using this ADS.
See more
Check out ApexSQL Plan, to view SQL execution plans, including comparing plans, stored procedure performance profiling, missing index details, lazy profiling, wait times, plan execution history and more

- Understanding PostgreSQL SUBSTRING function - September 21, 2024
- How to install PostgreSQL on Ubuntu - July 13, 2023
- How to use the CROSSTAB function in PostgreSQL - February 17, 2023


