Power BI Introduction
Power BI Desktop provides many useful visualizations with simple configurations. You can represent data visually in different forms that help users and management in data interpretation. You can explore a broad category of Power BI articles here on SQLShack.
It is always a good practice to work on the latest release of Power BI Desktop to make use of the latest enhancements and features available. If you do not have it, visit URL, download December 2019 release and install it.

You might be familiar with a hyperlink in a Microsoft Word document that allows specifying a URL using a familiar name. A user can click on the hyperlink, and it opens the web page for you. It is mostly useful for you in specifying web page references.
Let’s take a SQLShack articles report in Power BI desktop, that shows a few of my published articles in the year 2019. It contains information such as article title, article URL along with email address.
We have a reference URL for each article in a separate column. Users can copy the URL in a web browser for reading the article.
Do we want a user to copy each URL, paste it into the web browser and open it? No, Power BI Desktop provides you with adding a URL hyperlink in the report as well.
Import data for the report
Launch Power BI Desktop and import data using the Get Data menu.

Click on Excel and specify an excel sheet location.

Once you click ok, it establishes a connection to excel source, and you get a data preview.

Click on Load. In the above image, we see Load and Transform Data buttons disabled. We need to check the excel sheet, and it enables both buttons.

It loads data, and you see excel columns in Power BI Desktop fields pane.

Design a report
Now click on a table visual from the visualization section. It draws a layout for you in the visualization pane, as shown below.
Check the required columns, and it gives you a list as shown below.
Let’s do quick formatting for this.
-
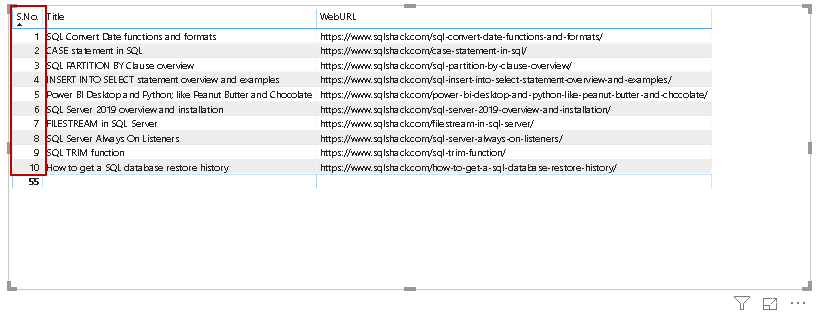
[S.No.] columns are not sorted according to numbers. Click on [S.No.] and sort the rows in ascending order

-
Currently, font size is small. Increase font size so that we can easily read the texts. To change font size, click on the chart, and increase the value font size, as shown below
-
Similarly, you can increase the size for the table header and change background color as well
WebURL Modeling
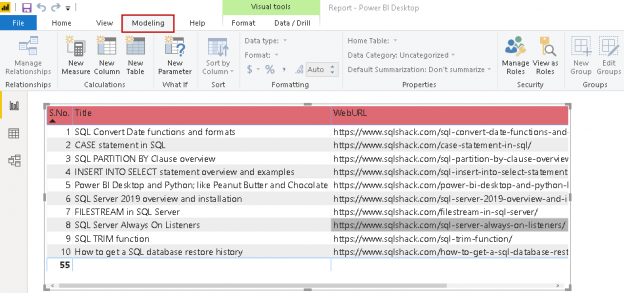
Once our report formatting is complete, click on the Modeling tab in the menu ribbon.

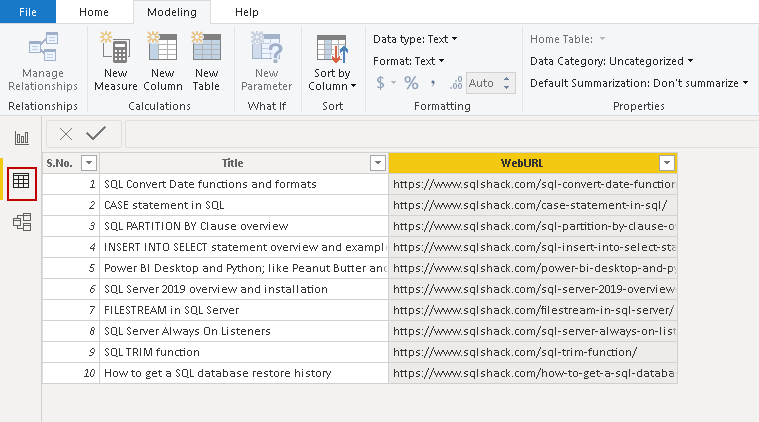
In the Modeling tab, we get an option for data categorization. We can do data categorization in the data viewer tab. Click on the highlighted data tab, and you see your data as shown below.

Here, select the WebURL column and click on Data Category. By default, all data columns are uncategorized.
We can use the following categories for our data.
- Address
- City
- Continent
- CountryRegion
- Country
- Latitude
- Longitude
- Place
- Postal Code
- State or Province
- Web URL
- Image URL
- BarCode
You might think:
- Why should I categorize my data?
- What impact will it have on my report if I categorize the data?
Once we define the data category, the Power BI Dashboard changes data in the report automatically. In this example, we require a hyperlink for the web URL in the report. Select the Web URL from the category list. Do you see any changes?

No changes in the report, right? Let’s switch to the report now using the icon highlighted in the below image.

Once you click on a report, you can see that Web URL contains a hyperlink for each referenced article. These hyperlinks are a blue color and underlined.
You can click on a Web URL, and it redirects you to a web page in the default browser.

It solves our requirement of a hyperlink in the Power BI Desktop report. You give this report to users but get the new requirement.
Use a URL icon for a WebURL
Users do not want to display a web URL as a hyperlink. Users want a hyperlink icon in front of the title. If they click on the URL icon, it should redirect to the corresponding web page. Let’s explore this solution, as well.
Click on the report formatting icon and search for a web URL. Alternatively, you can expand values and locate the URL icon. By default, it is off, as shown below.
Turn it on and view changes in the report. It removes the web URL and places a URL icon.
You can hover your mouse to view the URL or click on the icon to open this web page in the default browser.
Conditional formatting and WebURL hyperlink
We can also create hyperlinks in Power BI Report like a word document. For this, select the required title and search for Web URL in the formatting section. It is in off state, by default.

Here you get two options- Conditional formatting and Web URL. In the Conditional formatting, select the column in which we want a hyperlink. For my demo, change it to Title.
Now, drag the Web URL slider and turn it on. It opens a pop up for URL configuration. In the top, it displays the column we selected in the conditional formatting.
Here, choose a column that contains the URL. Our title will use these URLs for the hyperlink.

Click Ok, and you get a hyperlink in the title as well.

In this section, we will add an email address hyperlink.
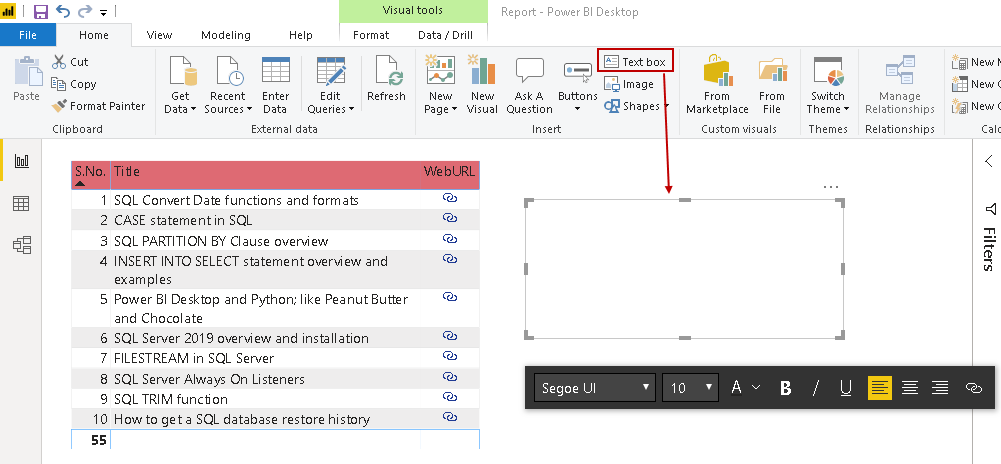
For this demonstration, add a text box as shown below.
Write some text in this text box and do formatting such as font category, size.
Email hyperlink and icon
Now, we want the following enhancements.
- Add a text hyperlink for the SQLShack. It is equivalent to a Microsoft word hyperlink
- Add hyperlink for the email address
In the first requirement, select SQLShack and click on the link icon.
It opens a text box. Enter URL in this box.
Click done, and you get the text hyperlink, as shown below.
For email, hyperlink selects the email address and click on hyperlink icon. It automatically shows the email address in the text box and adds a mailto: prefix for the email address.
Click done, and you can see email hyperlink.
Users can click on this email hyperlink, and it redirects you to an appropriate email client such as outlook, mail.
It gives a warning message that Power BI desktop wants to launch a mail application that is not a part of it.

Click on Allow. It opens a new mail message. It puts the hyperlink email address in the To: list.

It is especially useful in case you want to specify email address in the report for any issues with the reports shared with the user. Users do not need to copy mail address or write it that might have spelling mistakes.
Now, let’s make changes in the excel sheet and replace the web URL with an email address. Click on refresh data, and you see updated data in Power BI Desktop.
Now change the data category as Web URL and view the report. But we do not get the hyperlink for the email addresses.

Go back to data view and add a new column that concatenates prefix mailto: for the email addresses. We have previously observed that in textbox Power BI Desktop automatically adds this prefix, but in table data, we are required to add it manually.
Email = CONCATENATE(“mailto:”,Raj_links[WebURL])
Categorize this new column as a web URL and switch to the report view. Right-click on fields, refresh it, remove the WebURL column and tick on the new column Email.
You get email hyperlink as shown below.
Now, turn on the URL icon, and it changes icon per the following image.
Conclusion
In this article, we explored the use of a Web URL and Icon URL for Power BI Desktop reports. It helps us to provide references for URL and specifying a contact email address in the URL and icon form as well.
- Understanding PostgreSQL SUBSTRING function - September 21, 2024
- How to install PostgreSQL on Ubuntu - July 13, 2023
- How to use the CROSSTAB function in PostgreSQL - February 17, 2023


